For a deeper dive into last quarter’s Paid Search, Social Advertising, and Ecommerce Channel Advertising benchmarks and analysis, download your complimentary copy of the Skai Q4 2020 Quarterly Trends Report today!
Congratulations, marketers, you survived 2020!
It was a year unlike any other in our lifetimes for all of us, and one we won’t forget anytime soon. Even if we try. But before we totally consign 2020 to the history books, we have one more opportunity to see how digital advertising trends fared as we closed out the year.
For our business of online advertising, several key themes emerged by the middle of the year that would come to bear at the end of the year. First, online activity skyrocketed as a global pandemic forced many of us to spend a lot more time at home. Second, this led to a massive acceleration of online shopping and ecommerce. And third, we saw brands holding back on campaigns and budgets in the early part of the pandemic, only to release those funds later in the year.
All of these factors pointed to a very dynamic fourth quarter, and if we look at how much money was spent on digital ads over that three-month period, Q4 delivered. Now it is incumbent on us as marketers to use what we’ve learned to plan what we hope will be a successful 2021.
How to access Skai’s quarterly trends report, charts, and analysis
This edition of the Skai Quarterly Trends Report for Q4 2020 is drawn from an overall population of nearly $7B in annualized marketer spend, over 800 billion ad impressions, and 12 billion clicks. As one of the most well-respected datasets by those who follow advertising performance, it includes unique insights about what’s happening in the digital advertising industry on a macro level.
- Download the report to learn more about what happened in Q4 and the implications for marketers.
- Visit the Quarterly Trends Research Hub for even more in-depth analysis and access to previous reports.
- Check out the QTR interactive infographic where you can explore the numbers yourself for more granular insights.
Q4 2020 Key Takeaway #1 – Digital advertising spending rebounded from the pandemic for the holiday season
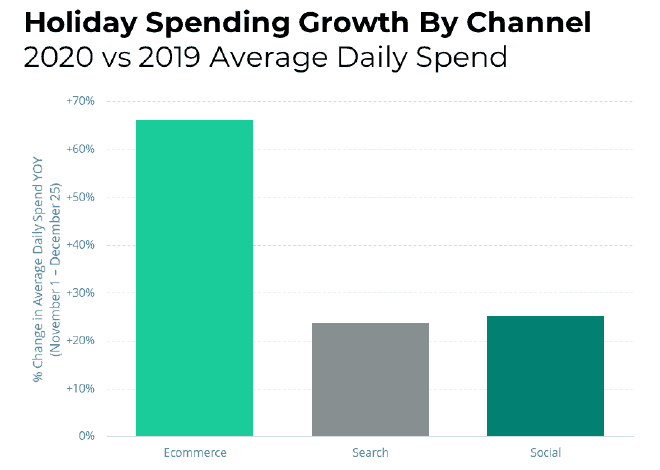
Digital marketers invested heavily in the fourth quarter across all channels, saving the best for last in terms of year-over-year spending growth even across an Ecommerce channel that was less affected by the pandemic. The underlying factors for this growth varied by channel.
With the holiday season in the rearview mirror, we can now take greater stock at how it performed. Looking at the period from November 1 through December 25, and only at advertisers in the Shopping & Retail category who spent money during that period both last year and this year, spending was up 66% for Ecommerce Channel Advertising. Spending increases were somewhat more modest for Paid Search (24%) and Social Advertising (25%) in this category.
 Q4 2020 Key Takeaway #2 – Ecommerce Channel Ad (ECA) nearly doubles in spending year-over-year
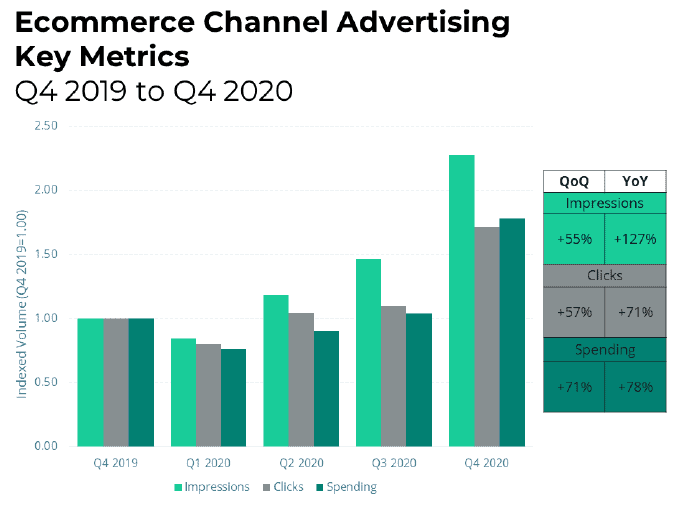
Ecommerce Channel Ad spending increased because the overall volume was way up. With so much shopping moving online because of the pandemic, both Prime Day and the holiday season amplified that behavior. Ultimately, that meant more people shopping for more things and seeing more ads, which subsequently meant more spending.
- 78% YoY Spending Growth. Prime Day plus holiday shopping plus more online shopping all combined for a breakout quarter.
- 127% YoY Impression Growth. More than double the number of ads were served in Q4 compared to the previous year.
 Q4 2020 Key Takeaway #3 – Search marketers were very aggressive during the holiday shopping season
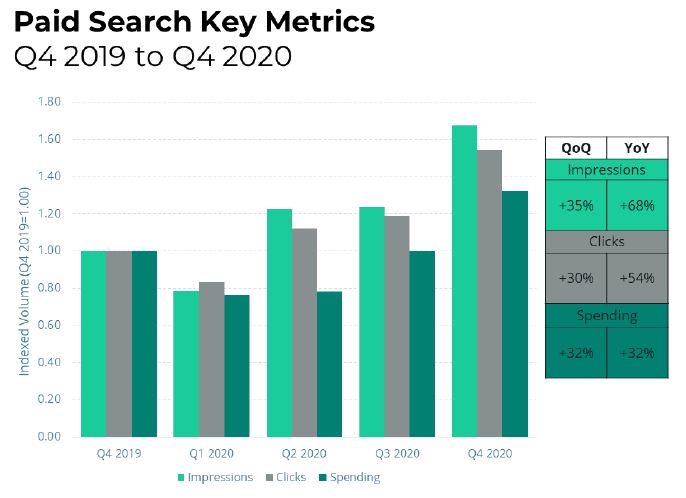
Paid Search spending increased in large part because of increased engagement with keyword ads. Higher click-through rates yielded more clicks, which yielded more spending. And why were those ads more engaging? Again, the pandemic likely played a role, as searching for things online became inherently more important. Another likely suspect is that new campaigns launched in Q3 were more likely to use the newest features being promoted by the search engines to attract clicks, and those features were then optimized by bidding algorithms as they continued into the fourth quarter.
- 32% YoY Spending Growth. Paid Search investment continued to grow at an accelerated rate, building on the year-over-year strength established last quarter.
- 54% Increase in Click Volume. Higher clickthrough rates for non-shopping search ads led to more clicks in the second half of 2020.
 Q4 2020 Key Takeaway #4 – Social advertising costs up as marketers bet big on the channel
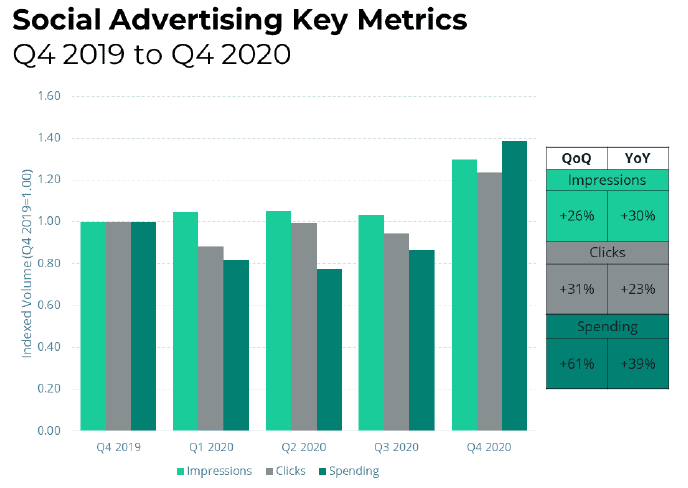
Social Advertising spend was notably up in Q4 largely due to increased ad prices. CPMs ended the year over $2.00 higher than at the beginning of Q3, which points to the macro environment. Advertisers either paused campaigns or switched to broader, lower-priced strategies for both the pandemic and during periods of social unrest, which meant less competitive ad prices. As those advertisers have returned, competition has been restored and prices have increased again.
- 39% YoY Spending Growth. The one-two punch of holiday shopping and the 2020 election fueled the rebound in Social ad spending.
- 28% QoQ CPM Increase. Ad prices spiked sharply compared to last quarter and were also 7% higher than Q4 of last year.
Learn more about digital advertising’s Q4 2020 metrics and trends
This post is just a brief digest of the benchmarks and analysis we have for you. You have many ways to go deeper into the numbers:

 Q4 2020 Key Takeaway #2 – Ecommerce Channel Ad (ECA) nearly doubles in spending year-over-year
 Q4 2020 Key Takeaway #3 – Search marketers were very aggressive during the holiday shopping season
 Q4 2020 Key Takeaway #4 – Social advertising costs up as marketers bet big on the channel