Spending and Pricing Trends Across Paid Search, Social Advertising, and Retail Media
Prime Day was the big story in June, with the Amazon sales event driving more than half of retail media accounts on Skai to increase their ad budgets by at least ten percent versus the previous month. Overall, this yielded a 25% jump in spending in the channel, led by the Pets & Animals category (up 118%) and Computers & Electronics (up 67%).
Meanwhile, prices went up while spending declined in both Paid Search and Paid Social. Cost-per-click (search) and cost per thousand impressions (social) each saw a net increase of 10% compared to May, but lower ad volume led to single-digit decreases in overall spending in both channels. Not all categories were down for the month, however. In Search, Pets & Animals (up 19%), Beauty & Personal Care (up 16%) and Travel (up 13%) all showed increases in investment, while Social saw budgets rise in Home & Garden (up 27%) and Beauty & Personal Care (up 18%).
How do you measure up? Check out these benchmarks to see if your programs are on par with your industry peers or if you’re ahead or behind the curve.
This is a continuation of our monthly paid media snapshot series. As with any benchmark, your mileage may vary, but we hope this provides a bit more context for you as a marketer as you navigate the ups and downs of your program’s performance.
Monthly Paid Media Spend Snapshot – June 2021
Methodology note. For the purpose of these monthly benchmarks, only Skai accounts with spend above a minimum threshold for the previous three months are included in this analysis.
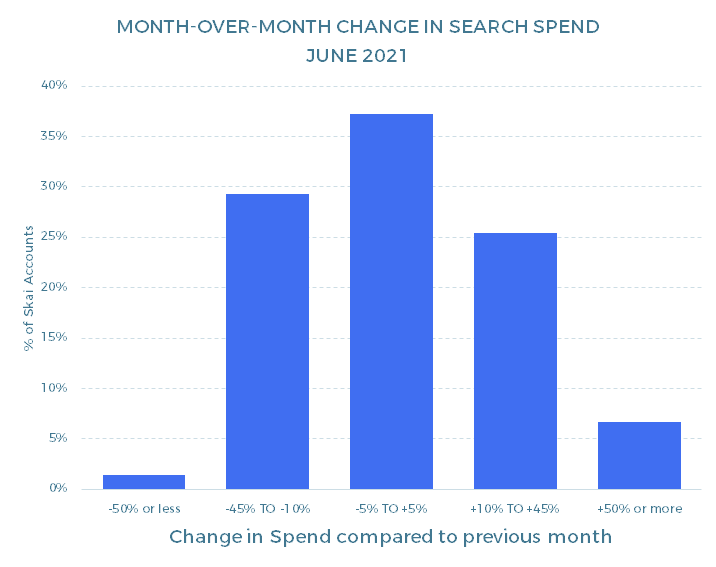
Paid Search spending
Overall, spending in paid search dropped 4% from May to June.
- 32% of paid search accounts spent +10% or more in June versus May, compared to 31% who spent -10% or less (+1% differential)
- 7% of accounts spent +50% or more in June versus May, compared to 1% of accounts spending -50% or less (+6% differential)
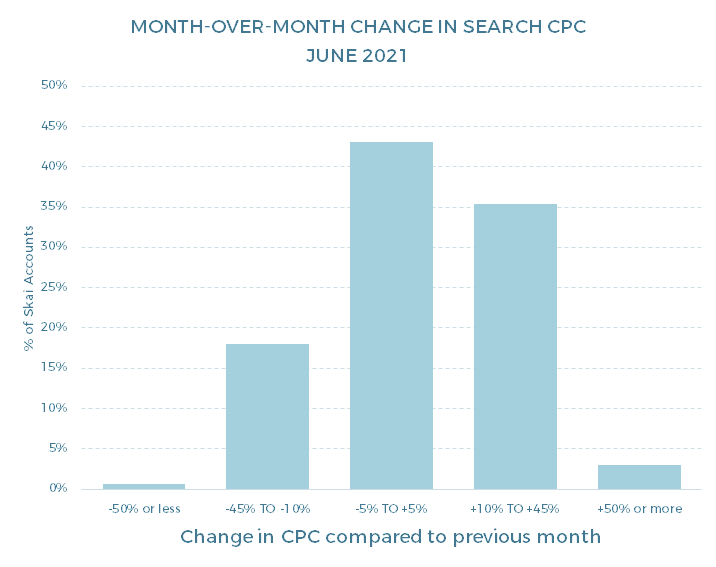
Paid Search CPCs
Overall, the average cost of a click in paid search advertising rose 10% from May to June.
- 38% of paid search accounts paid +10% or more per click in June versus May, compared to 19% who paid -10% or less (+19% differential)
- 3% of accounts paid +50% or more per click in June versus May, compared to 1% of accounts paying -50% or less (+2% differential)
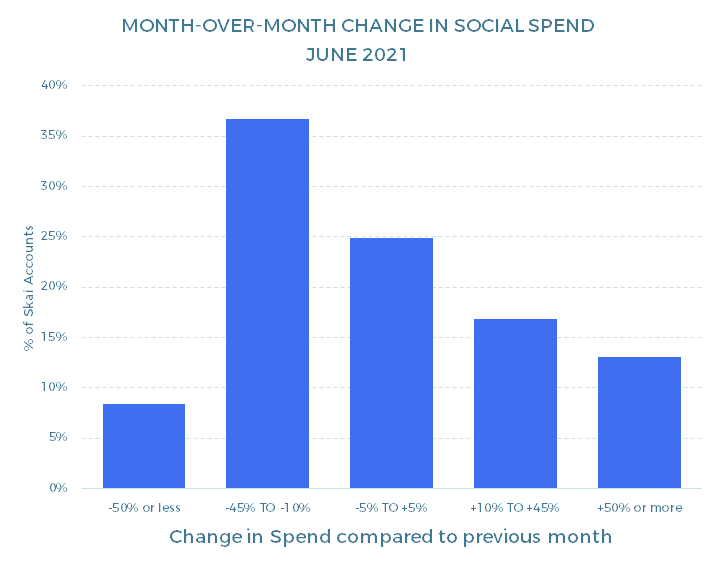
Social Advertising spending
Overall, spending in social advertising dropped 5% from May to June.
- 30% of paid social accounts spent +10% or more in June versus May, compared to 45% who spent -10% or less (-15% differential)
- 13% of accounts spent +50% or more in June versus May, compared to 8% of accounts spending -50% or less (+5% differential)
Social Advertising CPMs
Overall, the average cost of a thousand impressions in social advertising rose 10% from May to June.
- 55% of paid social accounts paid +10% or more per thousand impressions in June versus May, compared to 18% who paid -10% or less (+37% differential)
- 5% of accounts paid +50% or more per thousand impressions in June versus May, compared to 1% of accounts paying -50% or less (+4% differential)

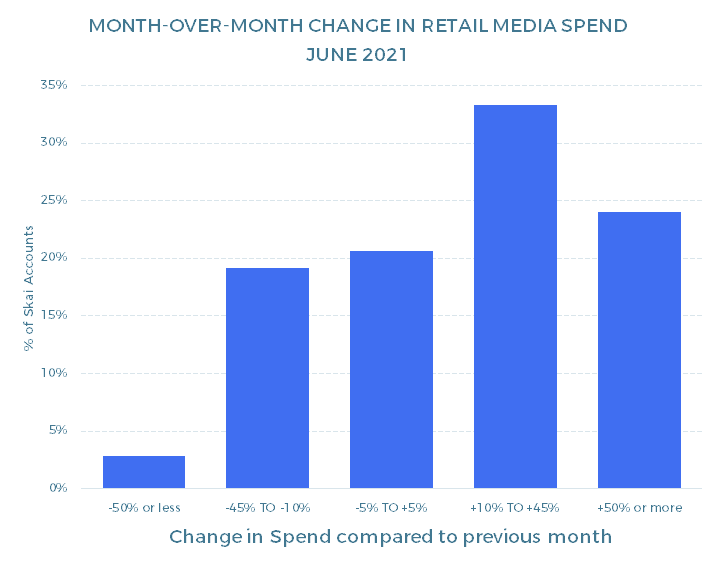
Retail Media spending
Overall, spending in retail media advertising increased 25% from May to June.
- 57% of retail media advertising accounts spent +10% or more in June versus May, compared to 22% who spent -10% or less (+35% differential)
- 24% of accounts spent +50% or more in June versus May, compared to 3% of accounts spending -50% or less (+21% differential)
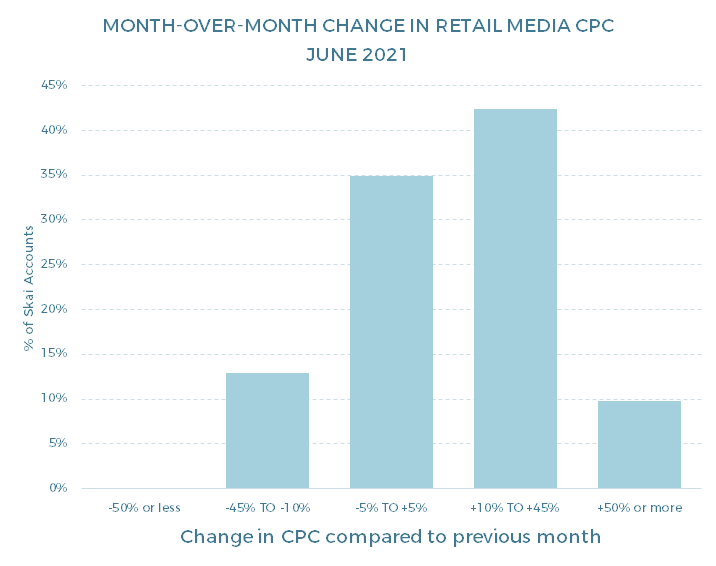
Retail Media CPCs
Overall, the average cost of a click in retail media advertising rose 18% from May to June.
- 52% of retail media advertising accounts paid +10% or more per click in June versus May, compared to 13% who paid -10% or less (+39% differential)
- 10% of accounts paid +50% or more per click in June compared to May, versus 0% of accounts paying -50% or less (+10% differential)
Check out more resources from Skai
Come back next month for the most up to date data. Until then, you can dive into more of our research via our Quarterly Trends Reports hub.
And please visit the Skai blog and Research & Reports page for ongoing insights, analysis, and interviews on all things related to digital advertising.