Download your complimentary copy of the Skai Q3 2020 Quarterly Trends Report today!
As we do every quarter, we look back at the previous quarter’s campaign performance data and trends to see what we can learn from digital advertising’s three biggest channels: Paid Search, Social Advertising, and Ecommerce Channel Advertising,
Because of how abnormal Q2 2020 was for marketers, there is much more to learn from looking at how digital advertising trended in Q3 as we head into the final quarter of the year. Did budgets that went away last quarter come back? Were there positive signs of recovery? How are advertisers adjusting to the new normal?
This edition of the Skai Quarterly Trends Report for Q3 2020 is drawn from an overall population of nearly $7B in annualized marketer spend, over 800 billion ad impressions, and 12 billion clicks. As one of the most well-respected datasets by those who follow advertising performance, it includes unique insights about what’s happening in the digital advertising industry on a macro level.
How to access Skai’s Q3 2020 quarterly trends report, charts, and analysis
- Download the report to learn more about what happened in Q3 and the implications for marketers.
- Visit the Quarterly Trends Research Hub for even more in-depth analysis and access to previous reports.
- Check out the QTR interactive infographic where you can explore the numbers yourself for more granular insights.
Q3 2020 Key Takeaway #1 – Clear signs of recovery across digital advertising
Deferred spending was the biggest story in Q3 across Paid Search and Social Advertising, with search making a strong rebound from Q2 and social coming back from a July marked by advertiser boycotts.
One of the big questions brought on by the pandemic this year has been When will the advertising dollars come back?
From a paid search perspective, the answer seems to be July.
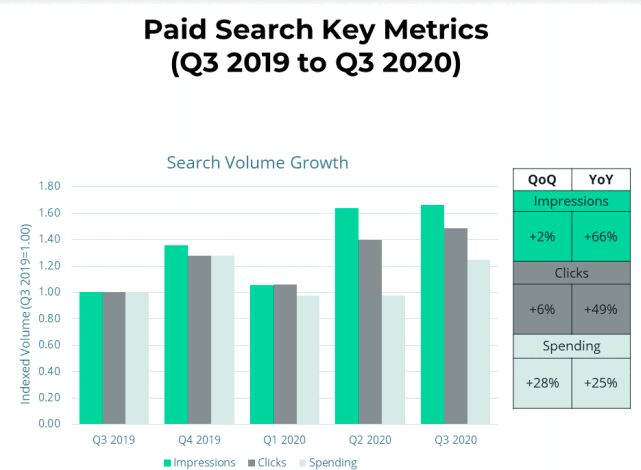
In fact, total paid search spending jumped 17% from June to July, as many advertisers considered that as a clear demarcation from the pandemic effects of Q2 and reinvested in the channel accordingly. Spending in Paid Search was up 28% quarter-over-quarter (QoQ) and up 25% year-over-year (YoY). What jumps off the page is the big uptick in year-over-year impressions (+66%) and clicks (+49%), which outpaced spending.
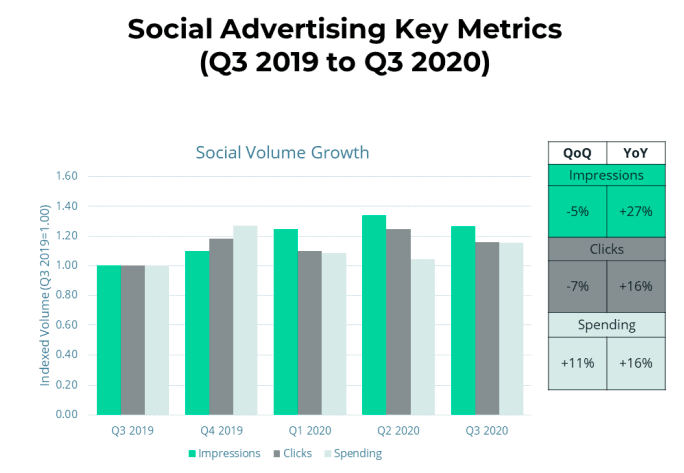
With impressions and clicks down QoQ (-5% and -7%) yet up YoY (+27% and +16%), it would seem that social advertisers may be getting back to narrower, more expensive audience targeting after zooming out with messaging for broader audiences last quarter when their customers may have been unable to convert because of the pandemic.
Q3 2020 Key Takeaway #2 – Advertisers followed the accelerated growth of online shopping brought on by the pandemic
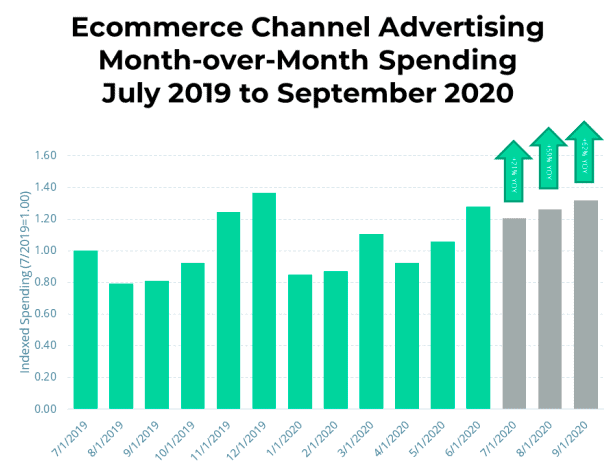
Ecommerce advertisers maintained the high level of monthly ad spending that they had established by the end of Q2.
Comprised of ads on Amazon.com and Walmart.com, this channel has continued to be a solid performer during the pandemic. Advertisers have followed consumers as they have flocked to these online shopping portals at an accelerated rate, a pattern which we began to see in our Q2 2020 Quarterly Trends Report and even towards the end of Q1.
Spend was up 16% quarter-over-quarter versus a Q2 that was already up big in the COVID-19 era and up 45% over Q3 2019. Impressions and clicks outpaced spend at +126% YoY and +56% YoY respectively, with a lot of that extra volume coming from changes in available ad inventory, as well as the introduction of Walmart into the mix.
Unlike Paid Search or Paid Social, Q3 for Ecommerce Channel Advertising is building off the strong growth we saw in Q2, and the growth continues to push higher. Investments in the channel climbed up every month of the quarter—up 21% YoY in July, +59% YoY in August, and up 62% YoY in September.
Q3 2020 Key Takeaway #3 – Practitioners continue to leverage intelligent machines
Automated features that control tactical campaign decisions at scale continue to gain traction across channels.
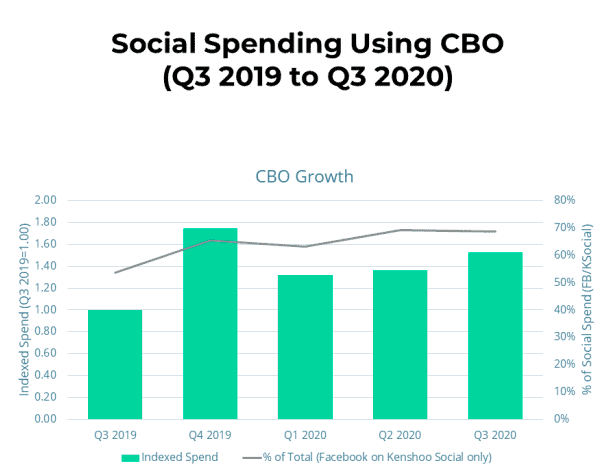
As ad offerings become more and more complex, we have been tracking the growth of campaign automation across Paid Search and Social Advertising in response. These features are becoming critical for marketers to navigate the proliferation of ad types and formats and still effectively hit key performance indicators, particularly at scale. Publishers report that using their automation features generally results in lower costs and higher conversions as ads and bids if these tools are leveraged to optimize for the highest ROI, for example
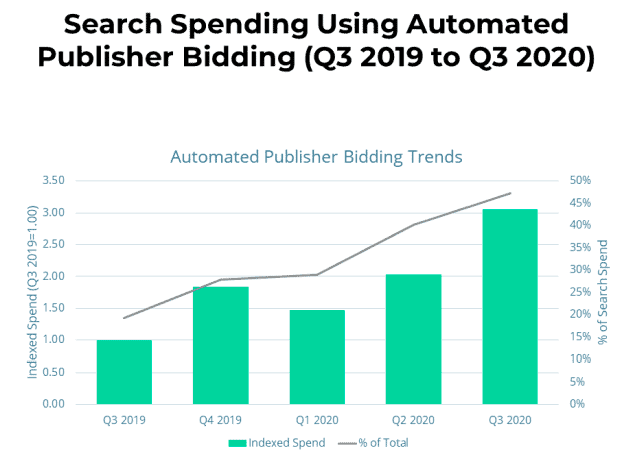
The share of total search spend for auto bidding from the search engines increased from 19% to 47% over the last five quarters. Meanwhile, spending increased just over 3X during that time.
Learn more about digital advertising’s Q3 2020 metrics and trends
You have many ways to go deeper into the numbers:
- Download the Skai Q3 2020 Quarterly Trends Report
- Visit the Quarterly Trends Research Hub
- Check out the QTR interactive infographic

