Instant Presentation: Transform your Skai dashboards into polished decks at the click of a button

A computer screen displays a Google Slides presentation titled Retail Media_AI_profiles_10-02-2023, showing a slide with line graphs of ad spend and revenue over time. Browser tabs and the Skai campaign management platform are visible in the background.

What is Instant Presentation?

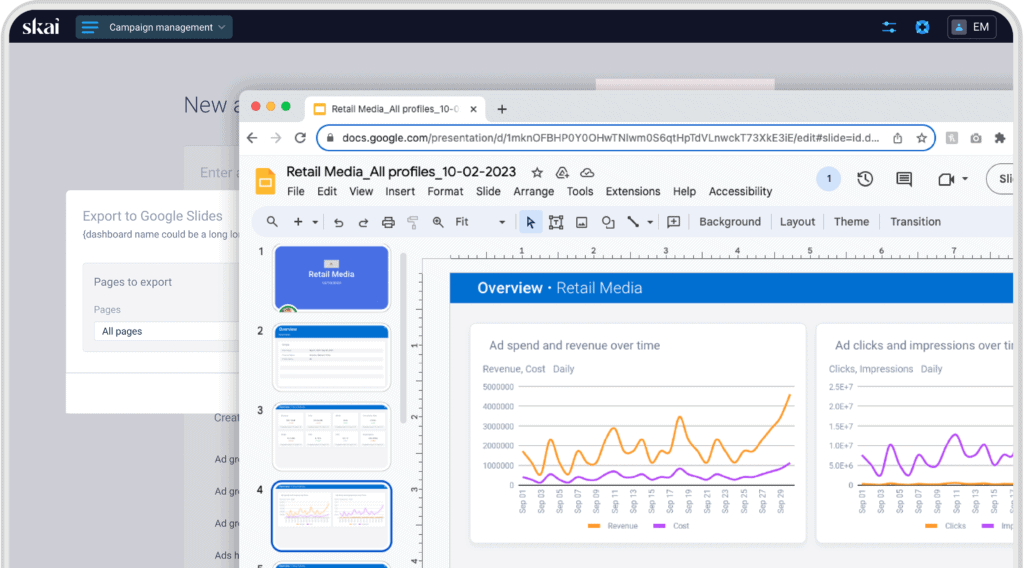
Performance recaps require labor-intensive data collection, analysis and content creation. Wouldn’t it be great if you could do this instantly? Effortlessly transform your Skai dashboards into polished decks in one click with Instant Presentation, keeping your clients and management informed. Reclaim your time for meaningful performance analysis and strategic enhancement.

What media is supported by this feature?

A large black lowercase a with a curved orange arrow underneath, pointing from left to right, forming a smile. This iconic Amazon logo represents one of the world's leading commerce advertising platforms and retail media solutions.
Six blue molecular-like shapes, each with two connected circles of different sizes, are arranged in a radial pattern on a light gray background, evoking the interconnected nature of commerce advertising platforms.
A red bullseye symbol with a solid red center, surrounded by a white ring and a thicker red ring on a light gray background—perfect for representing leading retail media solution or commerce advertising platforms.
Red Pinterest logo: a white stylized letter P inside a solid red circle, representing the platform's dynamic paid social solutions.
White lowercase f on a blue circular background, representing the Facebook logo, often used in mobile marketing and app marketing software.
Instagram logo in color
Two bold blue chevron shapes face outward, forming an open diamond shape with rounded inner corners—an emblematic mark for a leading commerce advertising company—set against a light gray background.
Bold orange letters “C” and “R” in a modern, stylized font on a white background. The shapes are rounded and thick, with the letters closely positioned side by side.
The image shows the Google logo, a large capital letter G in a sans-serif font, divided into four colored segments: red, blue, yellow, and green, each forming part of the G.
Microsoft logo: Four squares in a 2x2 grid, colored red, green, blue, and yellow, forming a window shape—symbolizing innovation reflected in their incrementality testing software and solutions.
A large green circle is centered against a solid black background.
A simple graphic of a carrot top: a green arrow with three prongs points down towards a partial orange circle, representing a carrot. The background is light gray.

What are the main use cases?

Client updates and performance recaps
Keep clients informed about campaign progress by generating presentations and QBRs that showcase key metrics, achievements, and next steps.
Keep stakeholders up-to-speed
Share project updates and performance metrics with internal teams, ensuring everyone is aligned and informed without extensive manual reporting.
Optimize more efficiently
Efficiently compile data from various marketing channels to create comprehensive campaign performance recaps to analyze trends and make data-driven decisions for ongoing improvement.

What are the main benefits?

With this data, users can correct misalignments between the search intent and the landing page their end users see after a click, providing a frictionless customer experience leading to improvement in Quality Score, Conversions and lower CPCs.

Time and effort savings
Eliminate manual data compilation and deck creation to save significant time and effort so you can prioritize overarching performance goals
Instant deck creation
Effortlessly create performance recaps for your clients, teams, or management, keeping stakeholders informed with a single push of a button
Omnichannel growth
Reach new omnichannel excellence by streamlining your performance reports across publishers