This analysis builds on the Monthly Paid Media Snapshot to look at changes in spending and ad prices by industry category. As with any benchmark, your results may vary, but we hope this provides more context for you as a marketer as you navigate the ups and downs of your program’s performance.
Methodology: Only Skai accounts with spend above a minimum threshold for the previous three months are included for these benchmarks. Where applicable, categories are assigned through a combination of algorithmic and manual methods, both at the account level and the Skai profile level. Please note that the selection criteria used here differ from the Skai Quarterly Trends Report and subsequently may not be consistent with those results in all cases. Starting in November 2023, paid social data has been expanded to include Meta, Pinterest, TikTok, LinkedIn, and YouTube.
How to read these charts
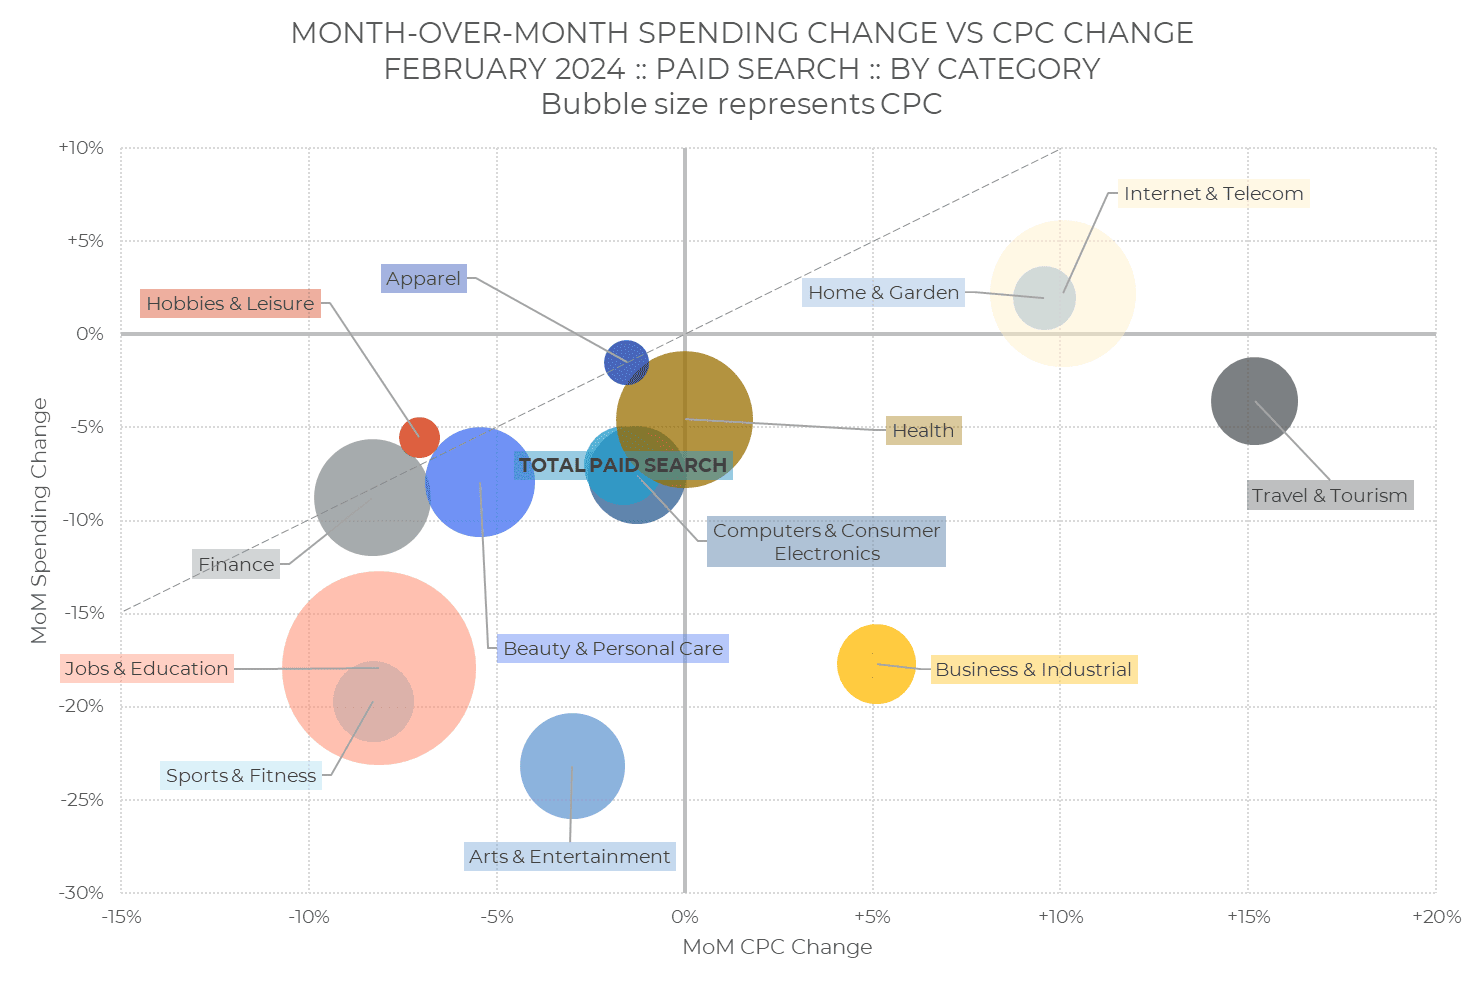
The x-axis represents month-over-month (MoM) changes in ad pricing–average cost per click (CPC) for paid search and retail media and average cost per thousand impressions (CPM) for paid social. The y-axis represents MoM changes in total ad spending for the category. The size of the bubble represents the CPC or CPM for the category. Larger bubbles have higher pricing.
The diagonal line indicates spending changes that are completely described by the change in pricing. Bubbles above the diagonal mean that ad volume—clicks for retail media and paid search, impressions for paid social—grew faster than pricing, while bubbles below the diagonal mean that volume grew slower.
Paid Search
Overall paid search spending decreased by 7% in February, while average CPC dropped by 2%.
When it comes to spending, Internet & Telecom and Home & Garden were the only categories that outspent January. But when you consider that February has 6% fewer days than the previous month–even in a leap year–several other categories at least outperformed that benchmark, namely Travel & Tourism, Apparel Hobbies & Leisure, and Health.
Nearly all categories where spending decreased month-over-month also experienced lower CPC compared to January, putting those in the bottom left quadrant of the chart.


Jobs & Education and Health have the largest bubbles on the chart, indicating that they have the highest CPC across categories
Social Advertising
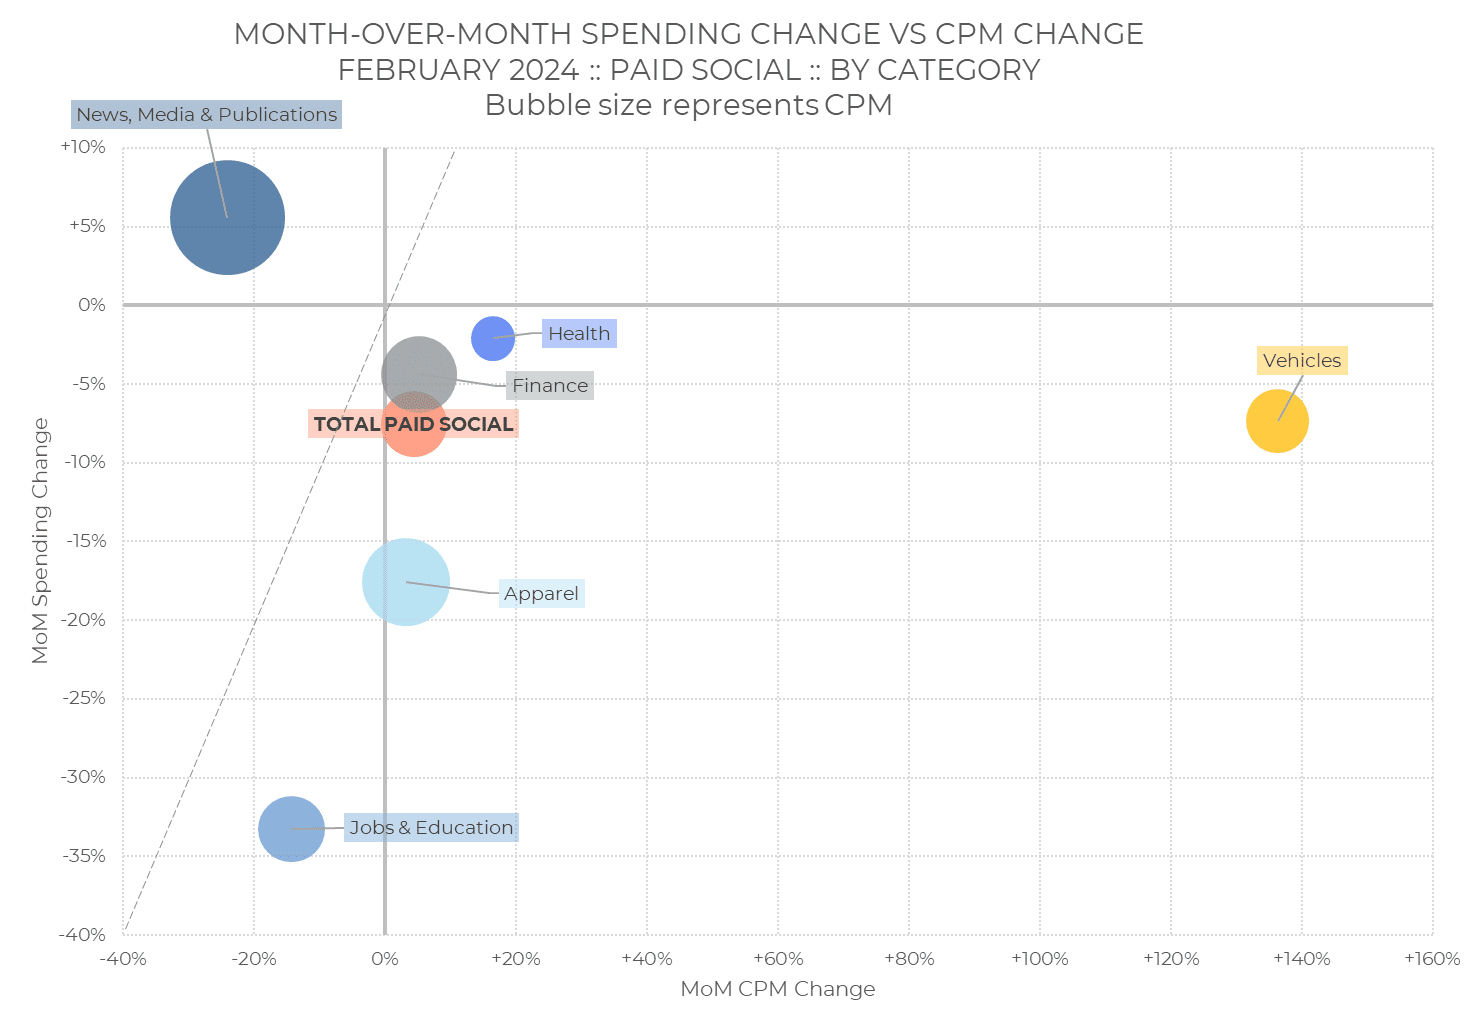
Overall, paid social spending dropped 8% in February, while average CPM grew 5%.
Three industry categories stood out in February for different reasons. The News, Media & Publications category was the only category that spent more in February before even considering the shorter month, and had the highest CPM as well.
The Vehicles category saw CPM more than double, although impression volume dipped enough that overall spend was down, putting it far out in the bottom right quadrant of our visualization.
And the Jobs & Education category saw a decline in both spending and CPM, landing it down and to the left beyond our other categories.
Retail Media
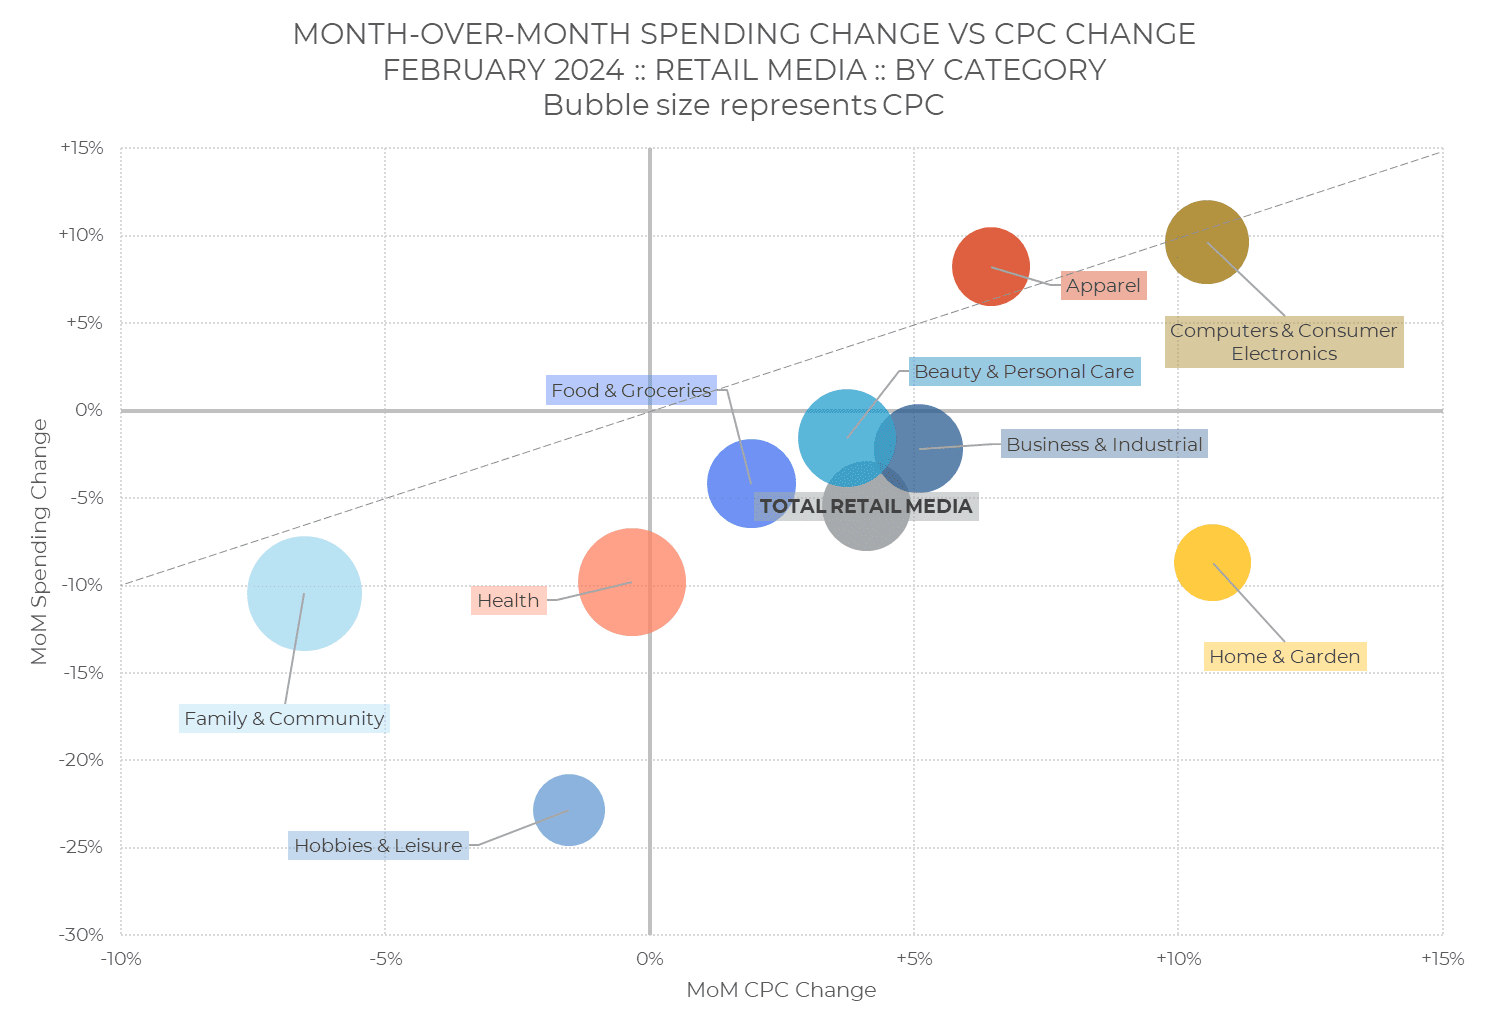
Overall, retail media spending decreased 5% in February, while average CPC increased 4%.
In the category breakdown, nearly every category had a higher CPC in February than in January, with the exception of Family & Community, Hobbies & Leisure, and by a hair, Health. Most CPCs were within 10% of last month in either direction, with Computers & Consumer Electronics and Home & Garden increasing beyond that threshold.
Only that technology category and Apparel spent more in total in February than in January, but when we account for the shorter month, Beauty & Personal Care, Business & Industrial and Food & Groceries were all above -6%, meaning they spent slightly more per day on average.
Hobbies & Leisure saw the biggest overall drop in spending, and its distance below the diagonal reference line means there was a big drop in click volume for that category.
Check out more resources from Skai
Come back next month for the most up-to-date data. Until then, you can dive into more of our research via our Skai Research Center or Quarterly Trends Reports hub.
And please visit the Skai blog and Whitepaper Library for ongoing insights, analysis, and interviews on all things related to digital advertising.