This analysis builds on the Monthly Paid Media Snapshot to look at changes in spending and ad prices by industry category. As with any benchmark, your results may vary, but we hope this provides more context for you as a marketer as you navigate the ups and downs of your program’s performance.
Methodology: Only Skai accounts with spend above a minimum threshold for the previous three months are included for these benchmarks. Where applicable, categories are assigned through a combination of algorithmic and manual methods, both at the account level and the Skai profile level. Please note that the selection criteria used here differ from the Skai Quarterly Trends Report and subsequently may not be consistent with those results in all cases. Starting in November 2023, paid social data has been expanded to include Meta, Pinterest, TikTok, LinkedIn, and YouTube.
How to read these charts
The x-axis represents month-over-month (MoM) changes in ad pricing–average cost per click (CPC) for paid search and retail media and average cost per thousand impressions (CPM) for paid social. The y-axis represents MoM changes in total ad spending for the category. The size of the bubble represents the CPC or CPM for the category. Larger bubbles have higher pricing.
The diagonal line indicates spending changes that are completely described by the change in pricing. Bubbles above the diagonal mean that ad volume—clicks for retail media and paid search, impressions for paid social—grew faster than pricing, while bubbles below the diagonal mean that volume grew slower.
Paid Search
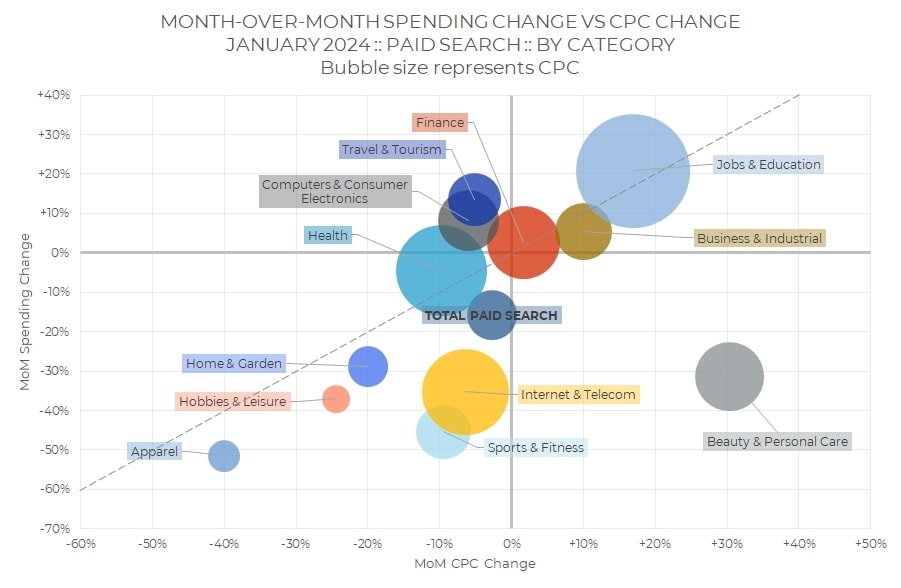
Overall paid search spending decreased 16% in January, while average CPC dropped 3%.
If we look at the y-axis of the chart, which represents aggregate search spending, we see most commerce categories shrank in January. This is what would be expected post-holiday. Meanwhile, categories like Jobs & Education, Finance, and Travel & Tourism started to pick up.


For categories like Apparel, Home & Garden, and Hobbies & Leisure, CPC also retreated in January, helping drive those QoQ spending decreases. Beauty & Personal Care, on the other hand, saw a big drop in clicks, with less spending despite higher click prices. Jobs & Education also saw CPC pick up, helping fuel spending growth in that category.
Jobs & Education was once again the largest bubble on the chart with the highest CPC, and Hobbies & Leisure had the lowest.
Social Advertising
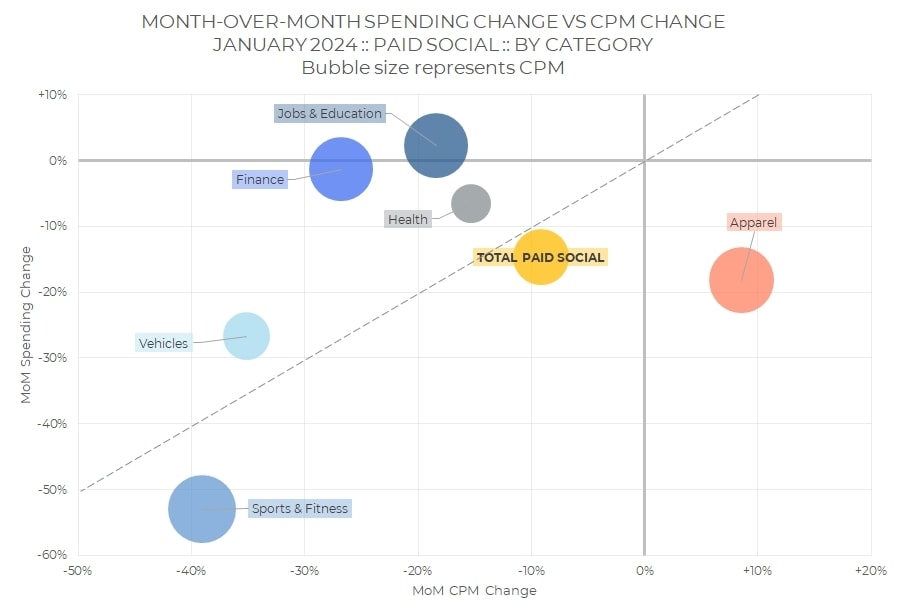
Overall, paid social spending dropped by 15% in January, while average CPM decreased by 9%.
Every named category except for Apparel in our analysis had a lower cost per thousand impressions in January than in February, with Sports & Fitness CPM dropping by nearly 40%.
As was the case with paid search, Jobs & Education stood out in terms of spending growth. In this case, it was the only named category that saw a month-over-month spending increase.
Jobs & Education was also part of the group of industry categories with higher CPM than the overall channel.
Retail Media
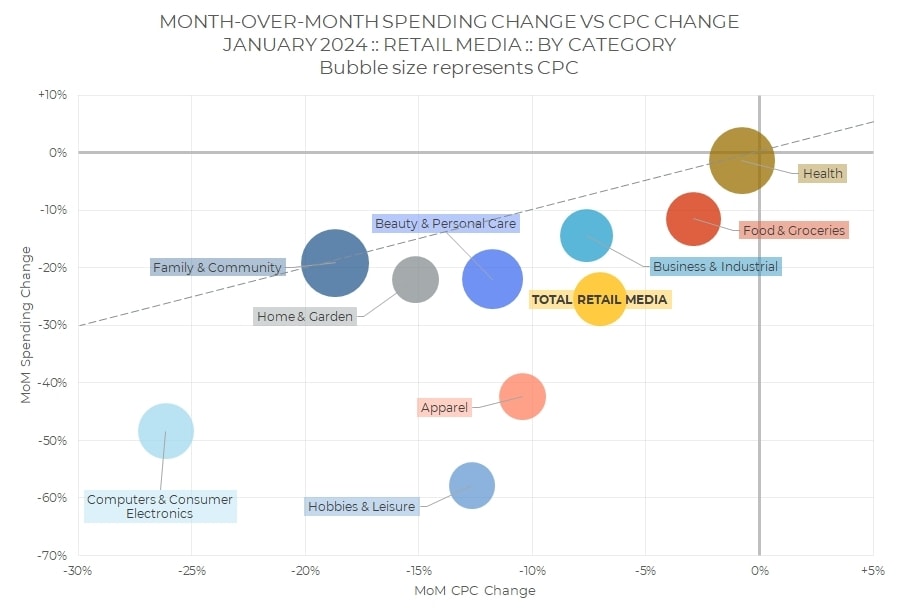
Retail media spending decreased 25% in January, while average CPC dropped 7%.
Every retail media category dropped in terms of both spending and CPC in January. That said, non-seasonal categories like Health and Food & Groceries saw the smallest decline in both metrics. In contrast, the gift-heavy categories of Computers & Consumer Electronics and Hobbies & Leisure and Apparel saw the biggest spending decreases.
Health and Family & Community have the largest bubbles on the chart, denoting the highest CPC, while Apparel and Home & Garden are among the lowest.
Check out more resources from Skai
Come back next month for the most up-to-date data. Until then, you can dive into more of our research via our Skai Research Center or Quarterly Trends Reports hub.
And please visit the Skai blog and Whitepaper Library for ongoing insights, analysis, and interviews on all things related to digital advertising.