This analysis builds on the Monthly Paid Media Snapshot to look at changes in spending and ad prices by industry category. As with any benchmark, your results may vary, but we hope this provides more context for you as a marketer as you navigate the ups and downs of your program’s performance.
Methodology: Only Skai accounts with spend above a minimum threshold for the previous three months are included in these benchmarks. Where applicable, categories are assigned through a combination of algorithmic and manual methods, both at the account level and the Skai profile level. Please note that the selection criteria used here differ from the Skai Quarterly Trends Report and subsequently may not be consistent with those results in all cases. Starting in November 2023, paid social data has been expanded to include Meta, Pinterest, TikTok, LinkedIn, and YouTube.
How to read these charts
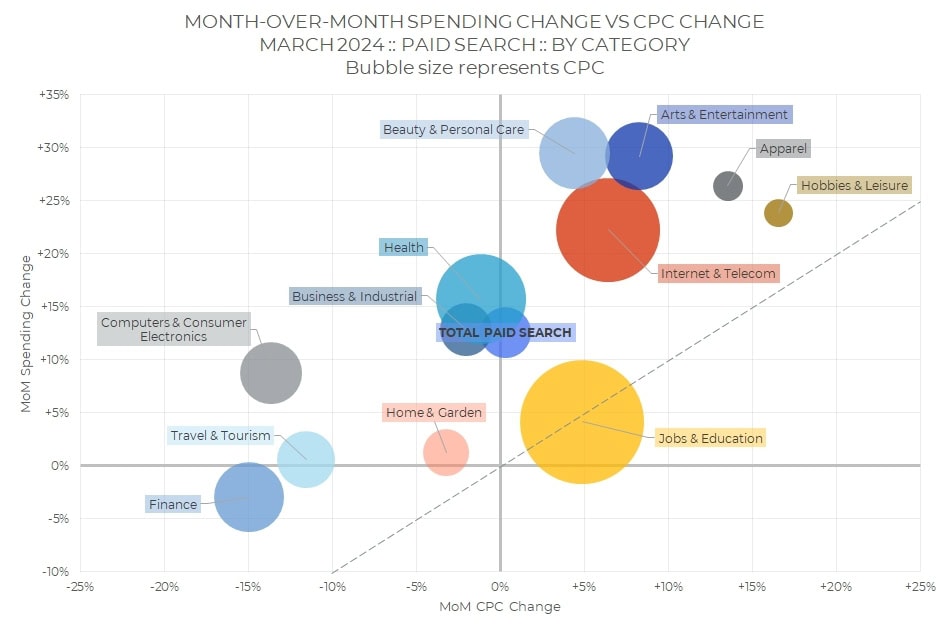
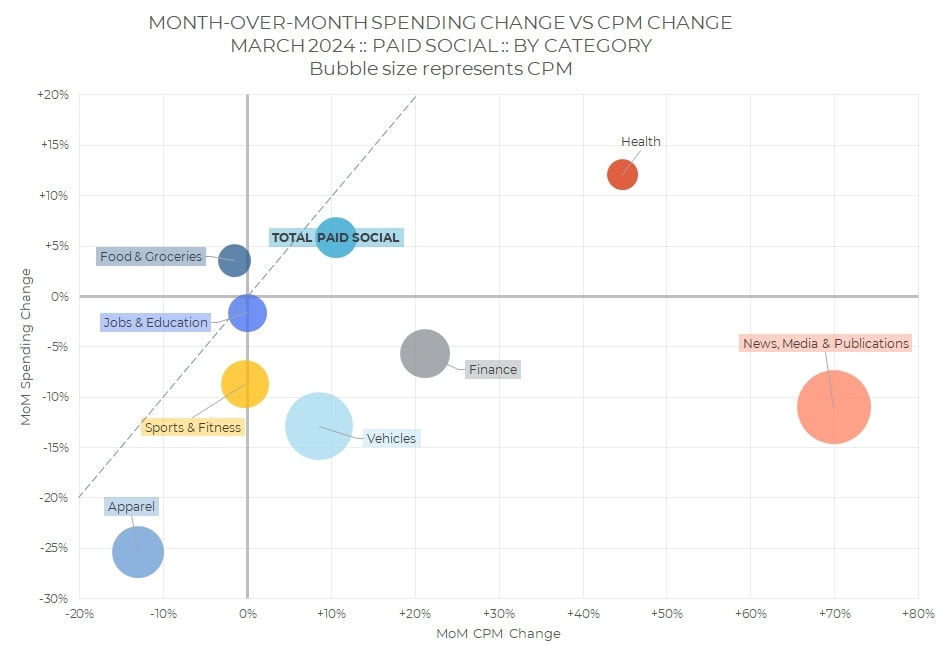
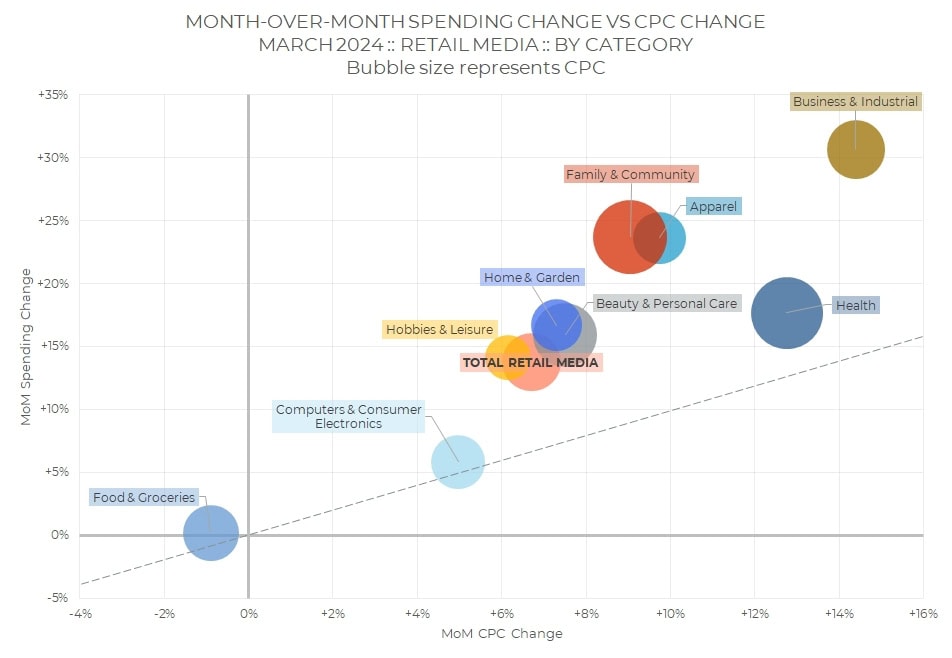
The x-axis represents month-over-month (MoM) changes in ad pricing–average cost per click (CPC) for paid search and retail media and average cost per thousand impressions (CPM) for paid social. The y-axis represents MoM changes in total ad spending for the category. The size of the bubble represents the CPC or CPM for the category. Larger bubbles have higher pricing.
The diagonal line indicates spending changes that are completely described by the change in pricing. Bubbles above the diagonal mean that ad volume—clicks for retail media and paid search, impressions for paid social—grew faster than pricing, while bubbles below the diagonal mean that volume grew slower.
Paid Search
Overall paid search spending grew 13% in March, while the average CPC stayed level.
With the benefit of two extra days providing a tailwind, every category except for Finance increased spending in March, including a cluster of five categories led by Beauty & Personal Care and Arts & Entertainment that grew by more than 20%.
Changes to CPC were as mixed as expected, given that overall ad prices did not change. Of the categories that saw price increases, Hobbies & Leisure and Apparel were farthest to the right, up over 10%. At the other end of the scale, Finance, Tech, and Travel had the biggest drop in CPC.


The size of the bubbles on the chart indicates relative CPC, which means that Jobs & Education was the highest-priced category in March, and Hobbies & Leisure was the lowest.
Social Advertising
Overall, paid social spending increased 6% in March, while average CPM grew 11%.
The Health category was the only category where spending grew faster than the overall channel. Most categories with enough volume to be included in the analysis spent less in March than in February, with Apparel dropping the most.
Ad prices were a different story, with the likes of Health and News, Media & Publications paying considerably more per thousand impressions. Here again, Apparel was at the other end of the scale, and that drop in pricing explains at least a portion of the accompanying drop in spending for the month.
News, Media & Publications also boasted the highest CPM of the categories in the analysis, followed by Vehicles. Health has the lowest prices for the month.
Retail Media
Overall, retail media spending grew 14% in March, while average CPC increased 7%.
Every category except for Food & Groceries was “up and to the right,” meaning that both spending and CPC increased from February to March. Business & Industrial, which includes subcategories like office supplies, led in both directions.
Health had the next-largest increase in CPC, while Apparel and Family & Community, which primarily sell baby and parenting products, were the runners-up in spending increases.
Family & Community and Health had the largest bubbles, indicating the highest CPC for the month. Hobbies & Leisure had the smallest bubbles.
Check out more resources from Skai
Come back next month for the most up-to-date data. Until then, you can dive into more of our research via our Skai Research Center or Quarterly Trends Reports hub.
And please visit the Skai blog and Whitepaper Library for ongoing insights, analysis, and interviews on all things related to digital advertising.