Breaking down monthly trends across digital channels by industry category

This analysis builds on the Monthly Paid Media Snapshot to look at changes in spending and ad prices by industry category. As with any benchmark, your results may vary, but we hope this provides more context for you as a marketer as you navigate the ups and downs of your program’s performance.
Monthly Industry Snapshot – September 2023
Methodology: For these benchmarks, only Skai accounts with spend above a minimum threshold for the previous three months are included. Categories are assigned through a combination of algorithmic and manual methods, both at the account level and the Skai profile level, where applicable. Please note that the selection criteria used here differ from the Skai Quarterly Trends Report and subsequently may not be consistent with those results in all cases.
How to read these charts
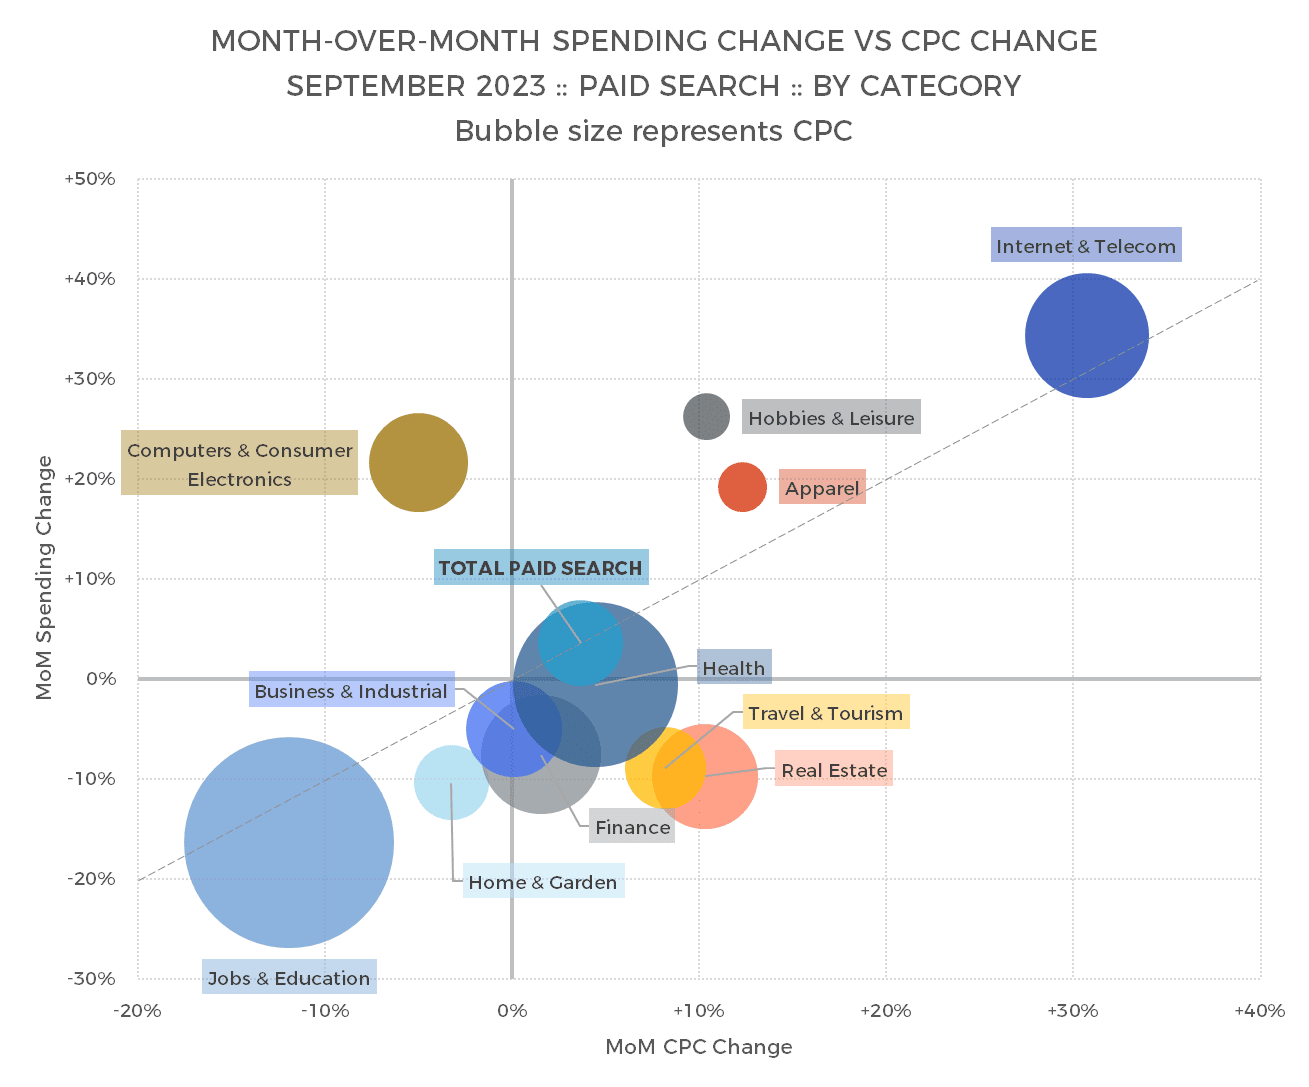
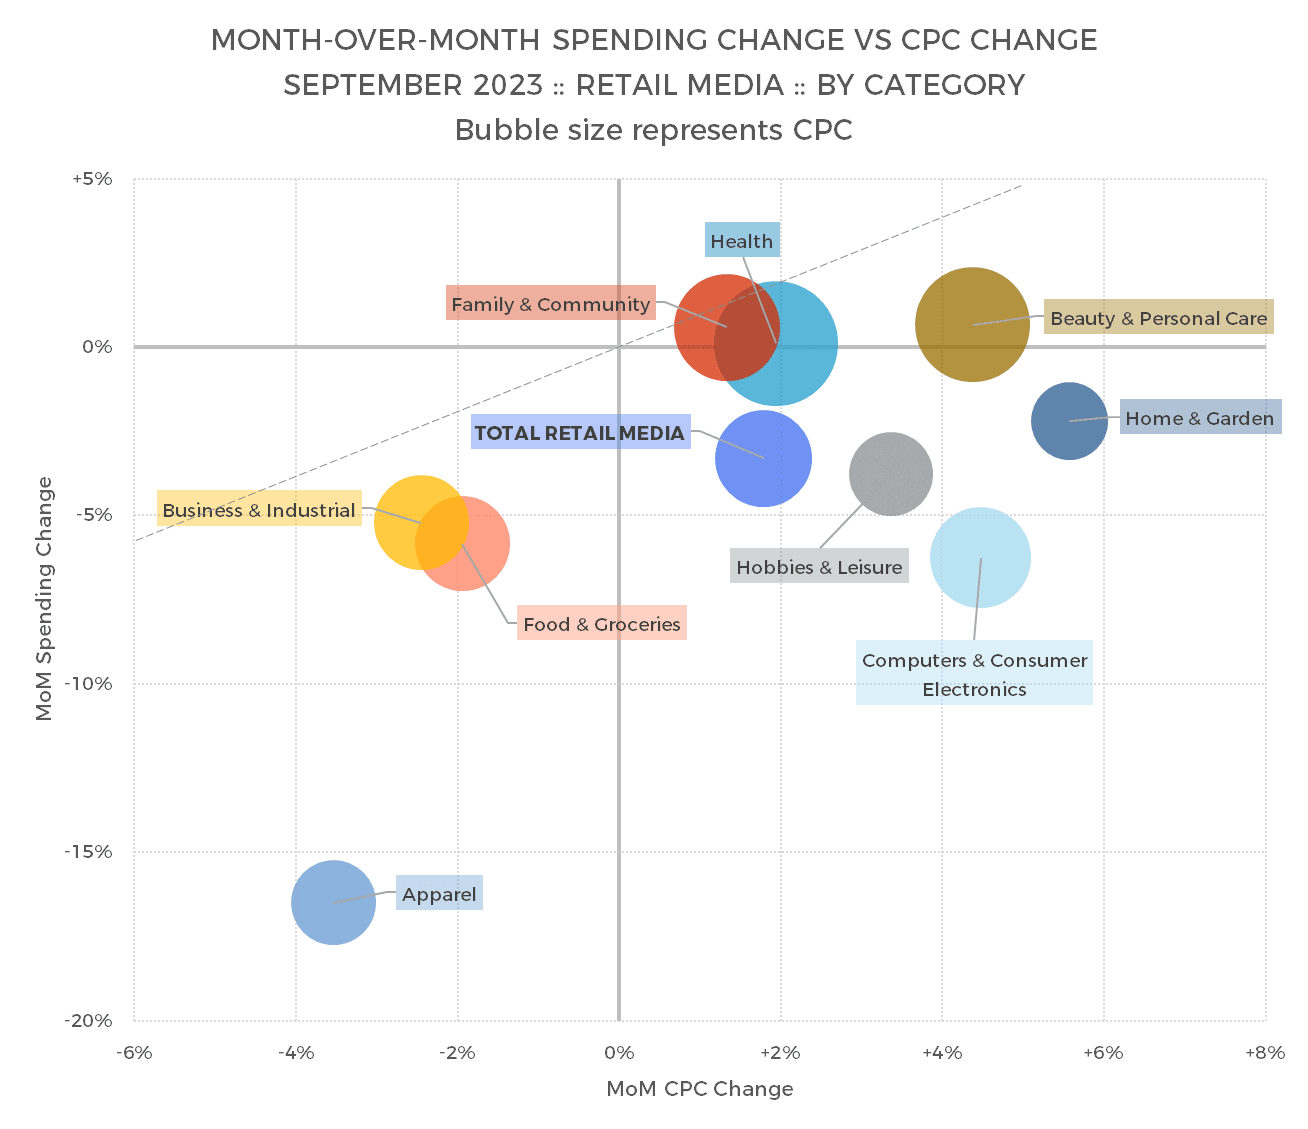
The x-axis represents month-over-month (MoM) changes in ad pricing–average cost per click (CPC) for paid search and retail media and average cost per thousand impressions (CPM) for paid social. The y-axis represents MoM changes in total ad spending for the category. The size of the bubble represents the CPC or CPM for the category. Larger bubbles have higher pricing.
The diagonal line indicates spending changes that are completely described by the change in pricing. Bubbles above the diagonal mean that ad volume—clicks for retail media and paid search, impressions for paid social—grew faster than pricing, while bubbles below the diagonal mean that volume grew slower.
Paid Search
Overall paid search spending grew 4% in September, while average CPC increased 4%.
The Internet & Telecom category saw the MoM increases in CPC and Spending. In the other direction, Jobs & Education dipped the most across both metrics. In both cases, the change in spending was roughly aligned with the change in ad pricing, and both categories have relatively high ad prices, along with the Health category.
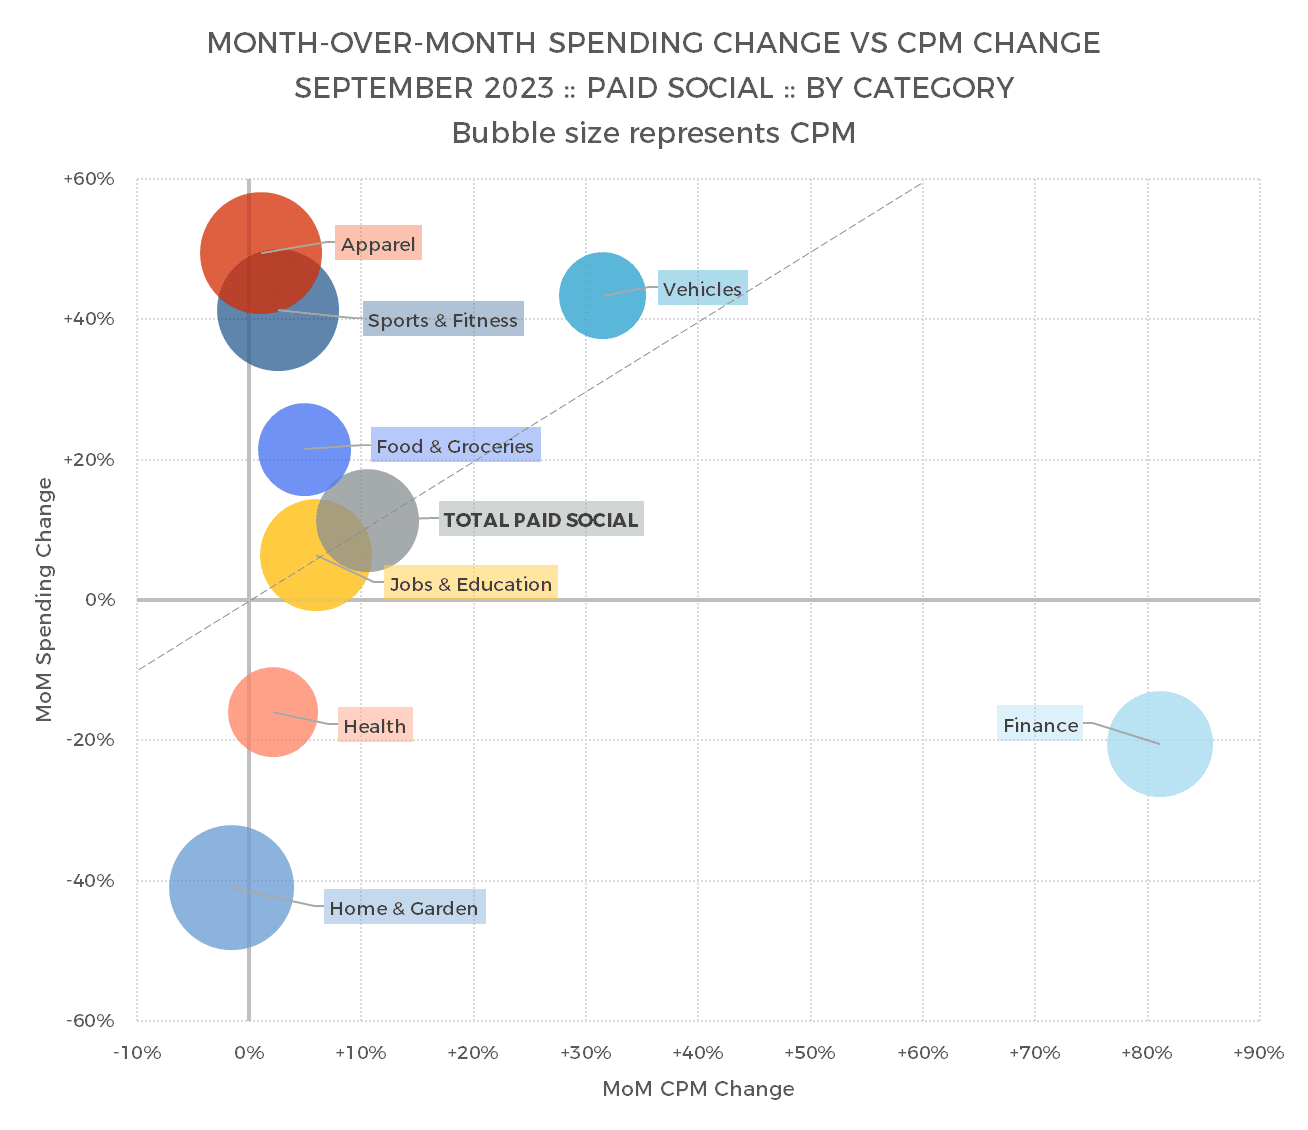
Social Advertising
Overall, paid social spending increased 11% in September, while average CPM grew 10%.


The Finance category saw CPM almost double, while overall spending declined compared to August, indicating a big dip in impression volume.
Health and Home & Garden were the only other two major categories where MoM spending dropped. There as well, the distance from the diagonal reference line suggests that impression volume played a significant role.
Retail Media
Overall, retail media spending decreased 3% in September, while average CPC increased 2%.
Only the Beauty & Personal Care, Health and Family & Community categories saw a MoM increase in spending, while Apparel saw the biggest drop in spending for the month.
Average CPC went up in a majority of categories, which means much of the overall shift for the month was due to fewer clicks.
Check out more resources from Skai
Come back next month for the most up-to-date data. Until then, you can dive into more of our research via our Quarterly Trends Reports hub.
And please visit the Skai blog and Research & Reports page for ongoing insights, analysis, and interviews on all things related to digital advertising.