Breaking down monthly trends across digital channels by industry category
This analysis builds on the Monthly Paid Media Snapshot to look at changes in spending and ad prices by industry category. As with any benchmark, your results may vary, but we hope this provides more context for you as a marketer as you navigate the ups and downs of your program’s performance.
Monthly Industry Snapshot – October
Methodology: For these benchmarks, only Skai accounts with spend above a minimum threshold for the previous three months are included. Categories are assigned through a combination of algorithmic and manual methods, both at the account level and the Skai profile level, where applicable. Please note that the selection criteria used here differ from the Skai Quarterly Trends Report and subsequently may not be consistent with those results in all cases.
How to read these charts
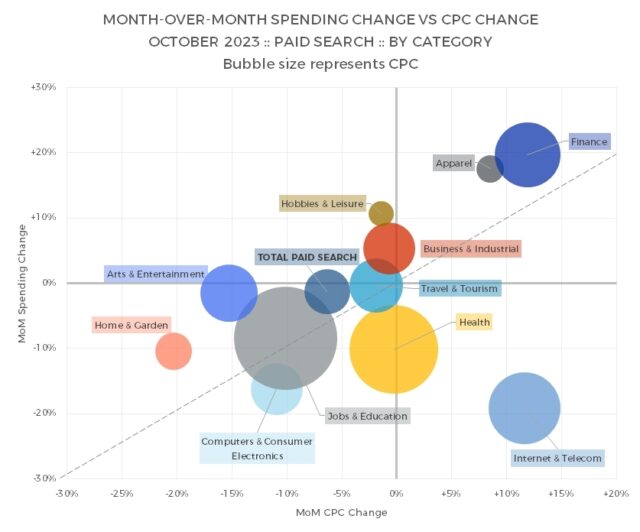
The x-axis represents month-over-month (MoM) changes in ad pricing–average cost per click (CPC) for paid search and retail media and average cost per thousand impressions (CPM) for paid social. The y-axis represents MoM changes in total ad spending for the category. The size of the bubble represents the CPC or CPM for the category. Larger bubbles have higher pricing.
The diagonal line indicates spending changes that are completely described by the change in pricing. Bubbles above the diagonal mean that ad volume—clicks for retail media and paid search, impressions for paid social—grew faster than pricing, while bubbles below the diagonal mean that volume grew slower.
Paid Search
Overall paid search spending decreased 1% in October, while average CPC dropped 7%.
The Finance category saw a 12% MoM increase in CPC that drove a 20% increase in spending, making it one of the standout performers for the month. A majority of categories saw lower CPC compared to September and of those, Computers & Consumer Electronics, Home & Garden and Jobs & Education all saw a drop in spending as well.
Hobbies & Leisure had the smallest bubble of all the categories, meaning it had the lowest CPC at $0.21, while Jobs & Education had the highest CPC at $3.46.
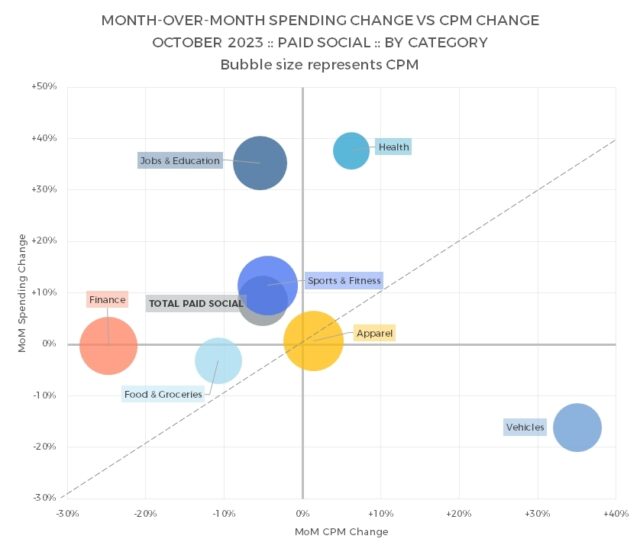
Social Advertising
Overall, paid social spending increased 8% in October, while average CPM decreased 3%.


The Health and Jobs & Education categories saw the largest month-over-month increase in spending, and the majority of categories saw higher levels of investment.
Vehicles had the largest increase in CPM despite lower monthly spend, while Finance CPM dropped by more than 20%.
The Health category had the lowest CPM across categories at $3.17, while several others had similar pricing at the higher end of the scale.
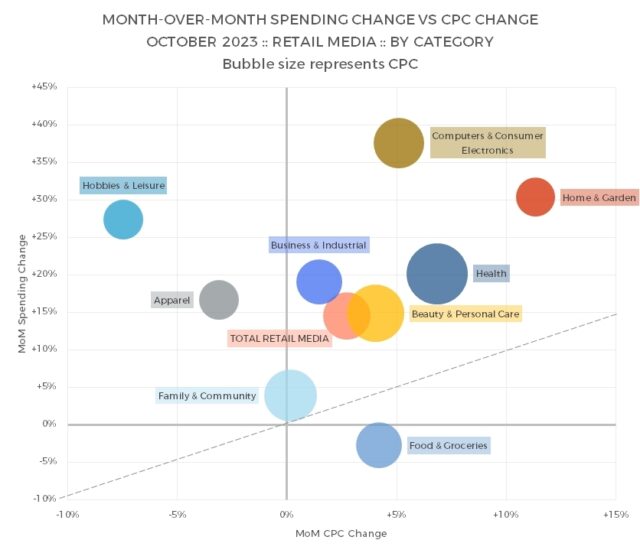
Retail Media
Overall, retail media spending grew 14% in October, while average CPC increased 3%.
The Amazon Prime Big Deal Days event drove month-over-month spending higher in most categories, with Computers & Consumer Electronics leading the way.
Average CPC rose the most in the Home & Garden category, while Hobbies & Leisure saw lower click prices but still grew spending levels.
The highest-priced category was Health at $1.71 per click, while Home & Garden had the lowest CPC at $0.70.
Check out more resources from Skai
Come back next month for the most up-to-date data. Until then, you can dive into more of our research via our Skai Research Center or Quarterly Trends Reports hub.
And please visit the Skai blog and Whitepaper Library for ongoing insights, analysis, and interviews on all things related to digital advertising.