This analysis builds on the Monthly Paid Media Snapshot to look at changes in spending and ad prices by industry category. As with any benchmark, your results may vary, but we hope this provides more context for you as a marketer as you navigate the ups and downs of your program’s performance.
Methodology: Only Skai accounts with spend above a minimum threshold for the previous three months are included for these benchmarks. Where applicable, categories are assigned through a combination of algorithmic and manual methods, both at the account level and the Skai profile level. Please note that the selection criteria used here differ from the Skai Quarterly Trends Report and subsequently may not be consistent with those results in all cases. Starting in November 2023, paid social data has been expanded to include Meta, Pinterest, TikTok, LinkedIn, and YouTube.
How to read these charts
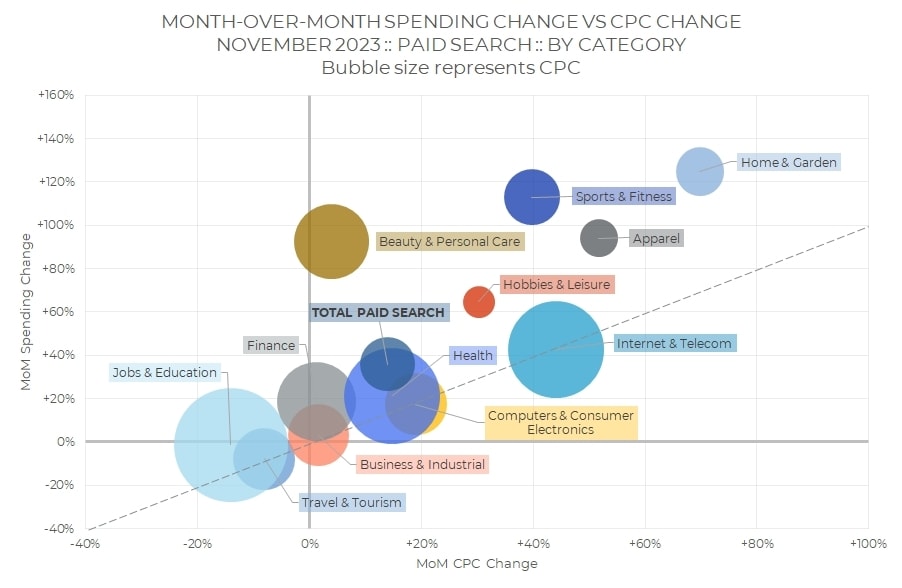
The x-axis represents month-over-month (MoM) changes in ad pricing–average cost per click (CPC) for paid search and retail media and average cost per thousand impressions (CPM) for paid social. The y-axis represents MoM changes in total ad spending for the category. The size of the bubble represents the CPC or CPM for the category. Larger bubbles have higher pricing.
The diagonal line indicates spending changes that are completely described by the change in pricing. Bubbles above the diagonal mean that ad volume—clicks for retail media and paid search, impressions for paid social—grew faster than pricing, while bubbles below the diagonal mean that volume grew slower.
Paid Search
Overall, paid search spending grew 36% in November, while average CPC increased 15%.
Nearly every category saw higher spending in November, led by retail-heavy categories that included Home & Garden, Apparel, and Beauty & Personal Care. Both Home & Garden and Apparel also saw CPC increases at the higher end of the spectrum.


Jobs & Education continued to command the largest bubble on the chart with the highest CPC, while Hobbies & Leisure and Apparel were among the lowest ad prices.
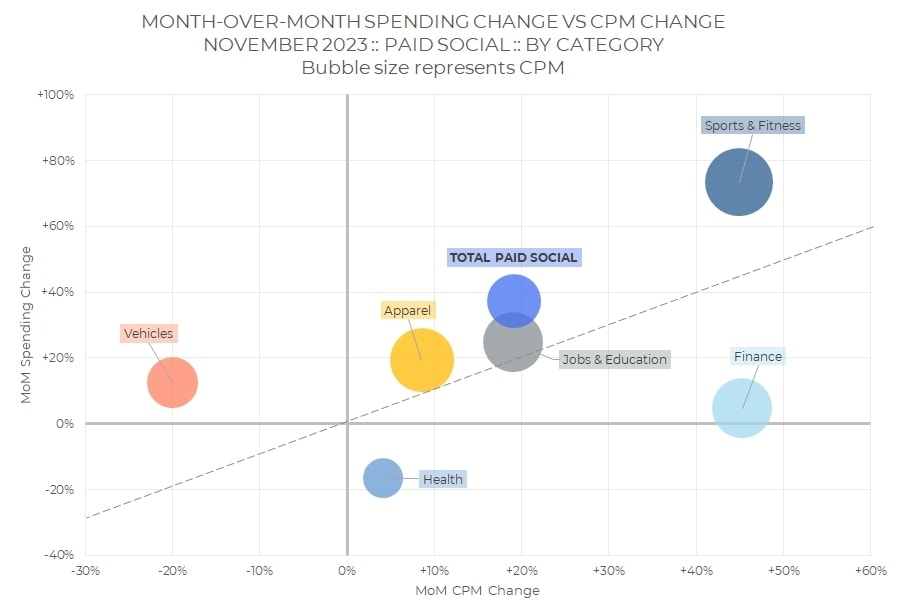
Social Advertising
Overall, paid social spending increased 37% in November, while average CPM grew 19%.
Every category except for Vehicles increased spending month-over-month, and every category except for Health had a higher CPM in November than in October. Sports & Fitness saw the greatest MoM increase in both metrics, while Finance matched the top CPM spike without the growth in spending.
Sports & Fitness also boasted the highest CPM, while Health has the lowest. The rest of the categories showed less differentiation.
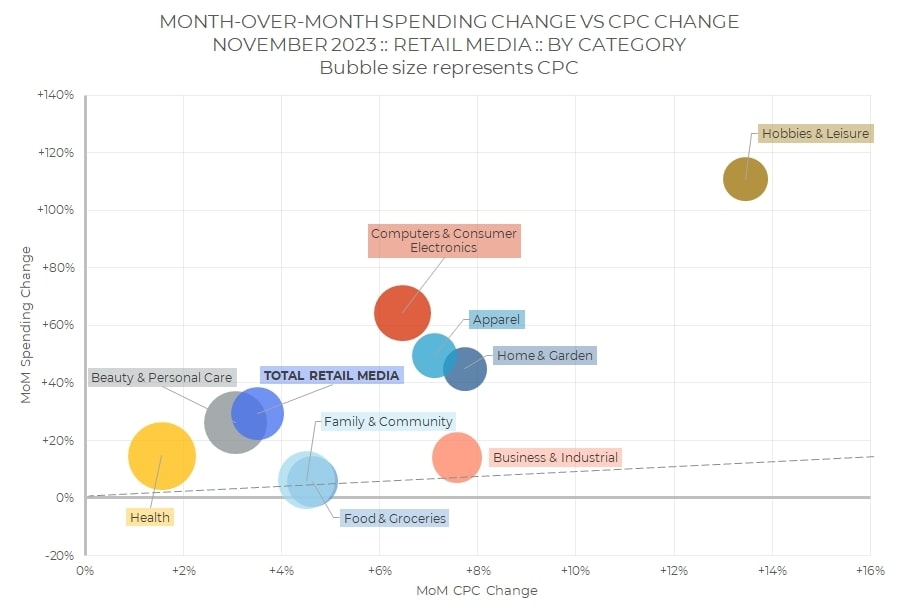
Retail Media
Retail media spending grew 29% in November, while average CPC increased 3%.
Holiday spending patterns drove both prices and spending higher in every Retail Media category, with Hobbies & Leisure out in front for both metrics. Computers & Electronics, Apparel, and Home & Garden all saw big growth as well, which is consistent with our analysis of the Thanksgiving weekend.
Health, Beauty & Personal Care, and Computers & Electronics have the largest bubbles on the chart, meaning they had the higher actual CPC in November. Apparel and Home & Garden were at the other end of the scale.
Check out more resources from Skai
Come back next month for the most up-to-date data. Until then, you can dive into more of our research via our Skai Research Center or Quarterly Trends Reports hub.
And please visit the Skai blog and Whitepaper Library for ongoing insights, analysis, and interviews on all things related to digital advertising.