Breaking down monthly trends across digital channels by industry category
This analysis builds on the Monthly Paid Media Snapshot to look at changes in spending and ad prices by industry category. As with any benchmark, your results may vary, but we hope this provides more context for you as a marketer as you navigate the ups and downs of your program’s performance.
Methodology: Only Skai accounts with spend above a minimum threshold for the previous three months are included in these benchmarks. Where applicable, categories are assigned through a combination of algorithmic and manual methods, both at the account level and the Skai profile level. Please note that the selection criteria used here differ from the Skai Quarterly Trends Report and subsequently may not be consistent with those results in all cases. Starting in November 2023, paid social data has been expanded to include Meta, Pinterest, TikTok, LinkedIn, and YouTube.
How to read these charts
The x-axis represents month-over-month (MoM) changes in ad pricing–average cost per click (CPC) for paid search and retail media and average cost per thousand impressions (CPM) for paid social. The y-axis represents MoM changes in total ad spending for the category. The size of the bubble represents the CPC or CPM for the category. Larger bubbles have higher pricing.
The diagonal line indicates spending changes that are completely described by the change in pricing. Bubbles above the diagonal mean that ad volume—clicks for retail media and paid search, impressions for paid social—grew faster than pricing, while bubbles below the diagonal mean that volume grew slower.
Retail Media
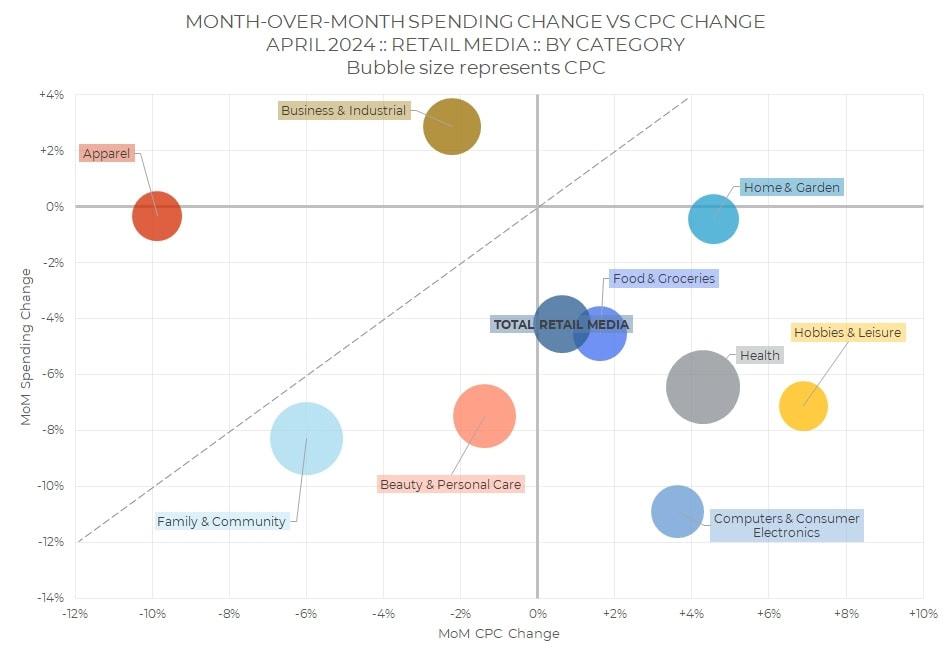
Overall, retail media spending decreased 5% in April, while average CPC increased 1%.
While the majority of categories showed a month-over-month spending drop, nearly every category is below the diagonal reference line, and several categories saw a CPC increase from March to April. In general, this is a reflection of the shorter month. We can still understand relative ups and downs in spending across categories, and through this lens, Business & Industrial, Apparel, and Home & Garden outperformed the overall channel.
Changes in click prices were mixed, with five categories increasing CPC and four having lower prices. Hobbies & Leisure saw the largest bump at +7% over March, while Apparel CPC dipped 10%.
Family & Community and Health continue to have the largest bubbles, indicating the highest CPC for the month. Hobbies & Leisure was once again the smallest.
Paid Search
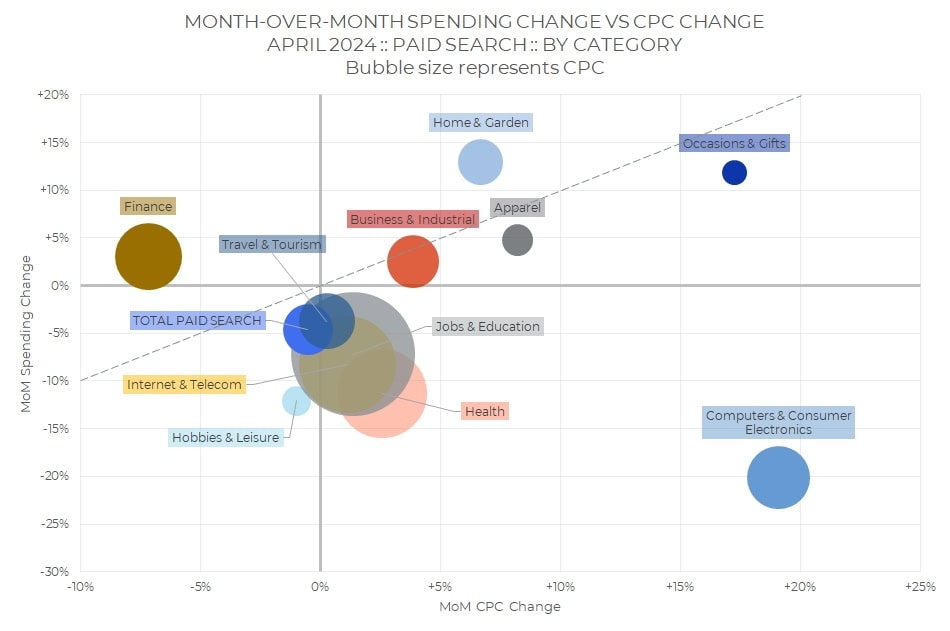
Overall paid search spending decreased 5% in April, while the average CPC stayed level.
As with retail media, the shorter month means that most of our categories fall below the diagonal line, meaning that click volume was part of the change in spending. One thing that sticks out is that two categories–Occasions & Gifts and Computers & Consumer Electronics–both saw large increases in CPC but had very different changes in overall spending, with Occasions & Gifts up with Home & Garden as categories with higher search expenditures, while Computers & Consumer Electronics had both the biggest increase in CPC and the biggest drop in spending, indicating a larger-than-average dip in total clicks.
CPC was higher in April for most of our categories, with Finance being the exception, with a 7% month-over-month drop in click prices. Several categories are clustered around the y-axis, not seeing much change at all.
The highest and lowest CPC–indicated by the size of the bubbles on the chart–are still Jobs & Education at $3.49 and Hobbies & Leisure at $0.20.
Social Advertising
Overall paid social spending dropped 8% in April, while average CPM decreased 9%.
Once again, a majority of categories fell below the diagonal, as the shorter month yielded fewer total impressions. Even so, Health and Finance both increased spending month-over-month, while Apparel saw the biggest change in spending in the other direction, dropping by 25%.
Most categories saw a drop in CPM, with the cost of one thousand impressions in Health and Apparel down more than the average for the entire channel. Jobs & Education was the only category with a higher CPM in April than in March.
Apparel, with the largest bubble, had the highest CPM at $7.07, while Food & Groceries had the lowest at $3.17.

Check out more resources from Skai
Come back next month for the most up-to-date data. Until then, you can dive into more of our research via our Skai Research Center or Quarterly Trends Reports hub.
And please visit the Skai blog and Whitepaper Library for ongoing insights, analysis, and interviews on all things related to digital advertising.
More like this
-

Cyber Five 2024: Gifts That Keep on Giving for Retail Media, Social Commerce, and Paid Search
-
Retail Media Spending Nearly Doubles on Black Friday 2024
-
Monthly Industry Snapshot – October 2024
-
Monthly Paid Media Spend Snapshot – October 2024
-
Monthly Industry Snapshot – September 2024
-

Amazon Prime Big Deal Days 2024 Wrap-up