In our continuing analysis of global search trends from Q1 in 2013, we have already covered spend data and a few other KPIs from our Global Search Advertising Trends Q1 2013 report. I invite you to join me Tuesday, April 30th for our Global Search Advertising Trends webinar where we’ll take an in-depth look at the report.
Today, we review spend numbers by region and check out cost-per-click (CPC) numbers for the last 5 quarters. Globally, CPC rates began to rise slightly in 2012 throughout the year to a high of $0.46 in Q3. Q1 of this year showed a slight drop YoY down to $0.39 from $0.41 in Q1 of 2012. This is a drop of $.06 QoQ from the heavy retail period of Q4 in 2012 ($0.45) and was expected as competition is generally fierce during that time of year.

As reported on Tuesday in the first post of this series, spend was up YoY 15% coming off of a strong 2012 that was 32% higher than the entire year of 2011. Spend in the U.S. helped fuel this growth and was up 24% YoY from the same quarter in 2012. It did dip a little QoQ from Q4 in 2012, but, once again, budgets and activity tend to elevate during the end of the year shopping season.

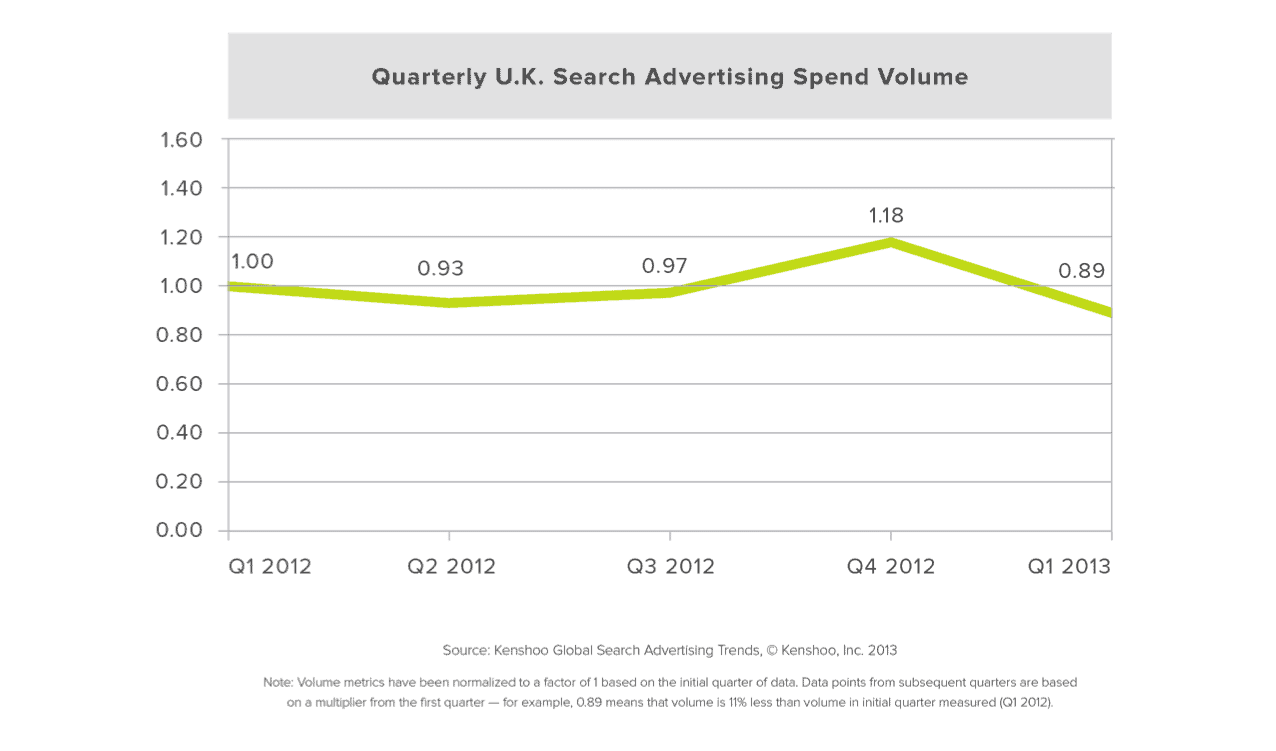
In the U.K., although spend spiked in the last quarter of 2012, it dropped YoY by 11% in Q1 of 2013.

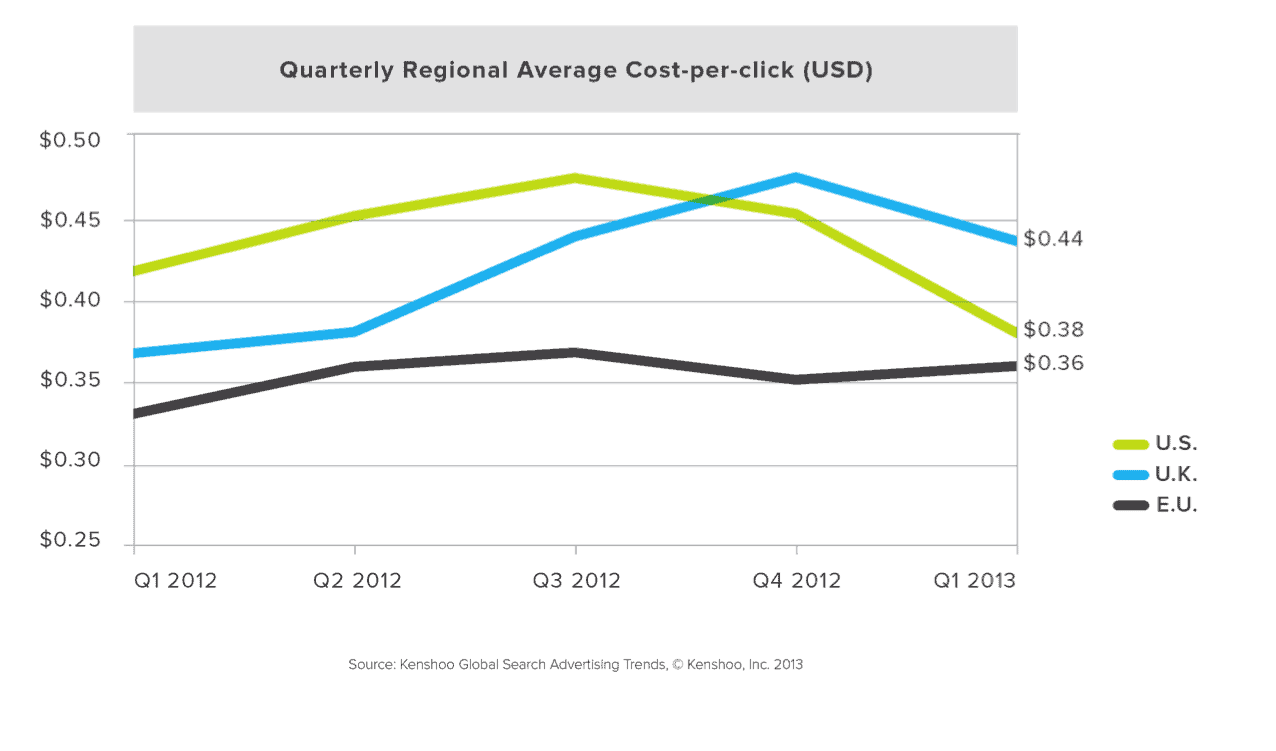
When we compare cost-per-click rates across the three regions of the U.S., the U.K. and the E.U. (basically all of Europe minus the U.K.), we see that the U.S. was $0.38 in Q1 of 2013. The E.U. was slightly below at $0.36 while the U.K surpassed the U.S. in Q4 of 2012 and landed at $0.44 in the first quarter of this year.

There’s more to come! In the next two days of blog coverage for our Global Search Advertising Trends Q1 2013 report, I will explore KPIs by device in both the U.S. and abroad, so continue reading our series for more analysis.
