Spending and Pricing Trends Across Paid Search, Social Advertising, and Retail Media
September spending grew 3% in September across paid search, and decreased 1% for retail media as both channels mostly stayed on a level course before the holiday quarter starts. Paid social increased 9%, which may signal upper funnel activity in advance of that holiday season.
Cost per click was inverted for paid search and retail media compared to spending, with retail media clicks costing 3% more and search clicks costing 2% less. This means click volume also played a role in the change in expenditures. By comparison, paid social CPM increased 9%, making ad price the dominant factor in spending growth in that channel.
How do you measure up? Check out these benchmarks to see if your programs are on par with your industry peers, ahead of the curve, or behind the curve.
This is a continuation of our monthly paid media snapshot series. As with any benchmark, your mileage may vary, but we hope this provides a bit more context for you as a marketer as you navigate the ups and downs of your program’s performance.
Monthly Industry Snapshot – September 2024
Methodology: Only Skai accounts with spend above a minimum threshold for the previous three months are included in these benchmarks. Please note that the selection criteria used here differ from the Skai Quarterly Trends Report and may not be consistent with those results in all cases. Starting in November 2023, paid social data has been expanded to include Meta, Pinterest, TikTok, LinkedIn, and YouTube.
How to read these charts
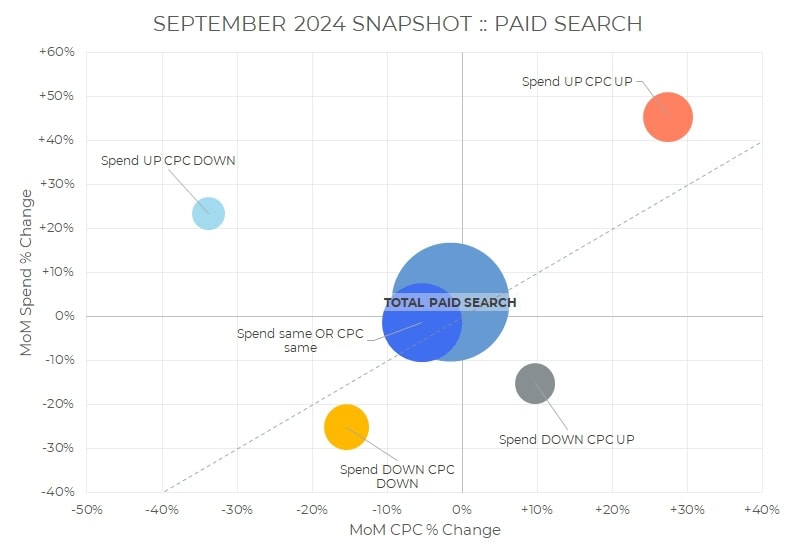
Accounts are divided into segments based on increases or decreases of at least 5% in monthly spending and CPC for retail media and paid search or CPM for paid social. Those segments are then plotted on a bubble chart where the x-axis represents the month-over-month (MoM) percent change in pricing for that segment, and the y-axis is the MoM percent change in total spending. Bubble size represents the percent of total Skai accounts.


The diagonal line indicates spending changes that are completely described by the change in pricing. Bubbles above the diagonal mean that ad volume—clicks for retail media and paid search, impressions for paid social—grew faster than pricing. In contrast, bubbles below the diagonal mean that volume grew slower.
Retail Media
Overall, retail media spending decreased 1% in September, while average CPC increased 3%. Average spending per day rose 2%.
- 36% of retail media accounts spent more in September than August compared to 43% who spent less, and the average price of a click increased for 34% of accounts and decreased for 26%, with the remaining share for each metric seeing no change.
- Of the segments that showed movement in both spending and pricing, the largest was where both spend and CPC increased, which comprised 19% of all retail media accounts in the analysis. Another 49% showed no change in either spending levels OR the price per click.

Paid Search
Overall paid search spending grew 3% in September, while average CPC dropped 2%. Average spending per day rose 7%.
- 36% of search accounts spent more in September than August compared to 39% who spent less, and the average price of a click increased for 39% of accounts and decreased for 28%, with the remaining share for each metric seeing no change.
- Of the segments that showed movement in both spending and pricing, the largest was where both spend and CPC increased, which comprised 18% of all paid search accounts in the analysis. Another 46% showed no change in either spending levels OR the price per click.
Social Advertising
Overall, paid social spending increased 9% in September, while average CPM grew 9%. Average spending per day rose 12%.
- 42% of social accounts spent more in September than August compared to 40% who spent less, and the average price of one thousand impressions increased for 56% of accounts and decreased for 24%, with the remaining share for each metric seeing no change.
- Of the segments that showed movement in both spending and pricing, the largest was where both spend and CPM increased, which comprised 28% of all paid social accounts in the analysis. Another 34% showed no change in either spending levels OR the price per thousand impressions.

Check out more resources from Skai
Come back next month for the most up-to-date data. Until then, you can dive into more of our research via our Quarterly Trends Reports hub.
Please visit The Breakthrough and the Skai Research Center for ongoing insights, analysis, and interviews on all things related to digital advertising.