Spending and Pricing Trends Across Paid Search, Social Advertising, and Retail Media
 Average daily spending for paid social advertisers jumped 15% from August to September. Paid search saw a more modest increase of 5%, while retail media spending per day was flat.
Ad prices were the main component of the paid social spending increase, with CPM rising 10% over last month. Retail media CPC was in line with spending trends, in that it mostly did not change on average. Paid search CPC declined slightly, meaning that the spending increase in the channel was primarily due to higher click volume.
How do you measure up? Check out these benchmarks to see if your programs are on par with your industry peers or if you’re ahead or behind the curve.
This is a continuation of our monthly paid media snapshot series. As with any benchmark, your mileage may vary, but we hope this provides a bit more context for you as a marketer as you navigate the ups and downs of your program’s performance.
Monthly Paid Media Spend Snapshot – September 2022
Methodology: For these benchmarks, only Skai accounts with spend above a minimum threshold for the previous three months are included. As of April 2022, spending benchmarks use average daily spend to control for longer and shorter months. Please note that the selection criteria used here are different from the Skai Quarterly Trends Report, which can sometimes lead to different results from the two analyses.
Paid Search spending
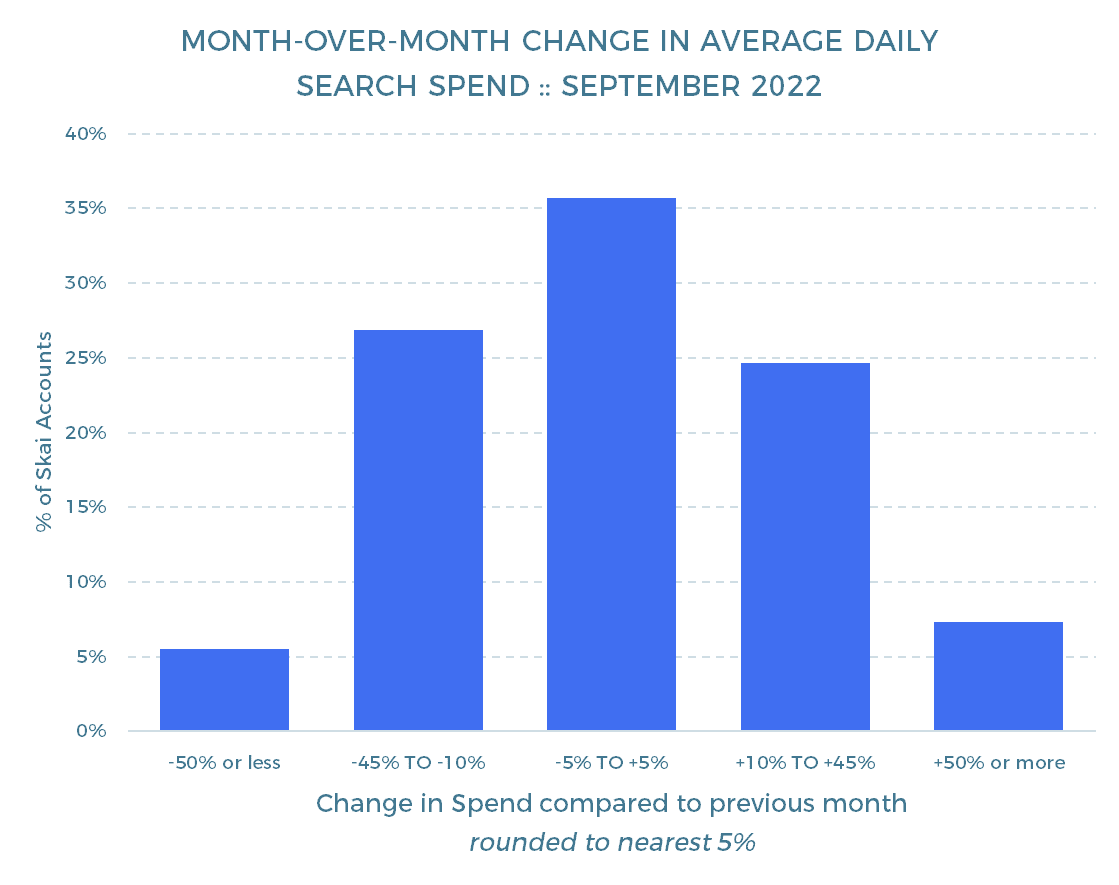
Overall, average daily spending in paid search increased 5% from August to September.
- 32% of paid search accounts spent +10% or more per day in September versus August, compared to 32% who spent -10% or less (0% differential)
- 7% of accounts spent +50% or more per day in September versus August, compared to 6% of accounts spending -50% or less (+1% differential)
Paid Search CPCs
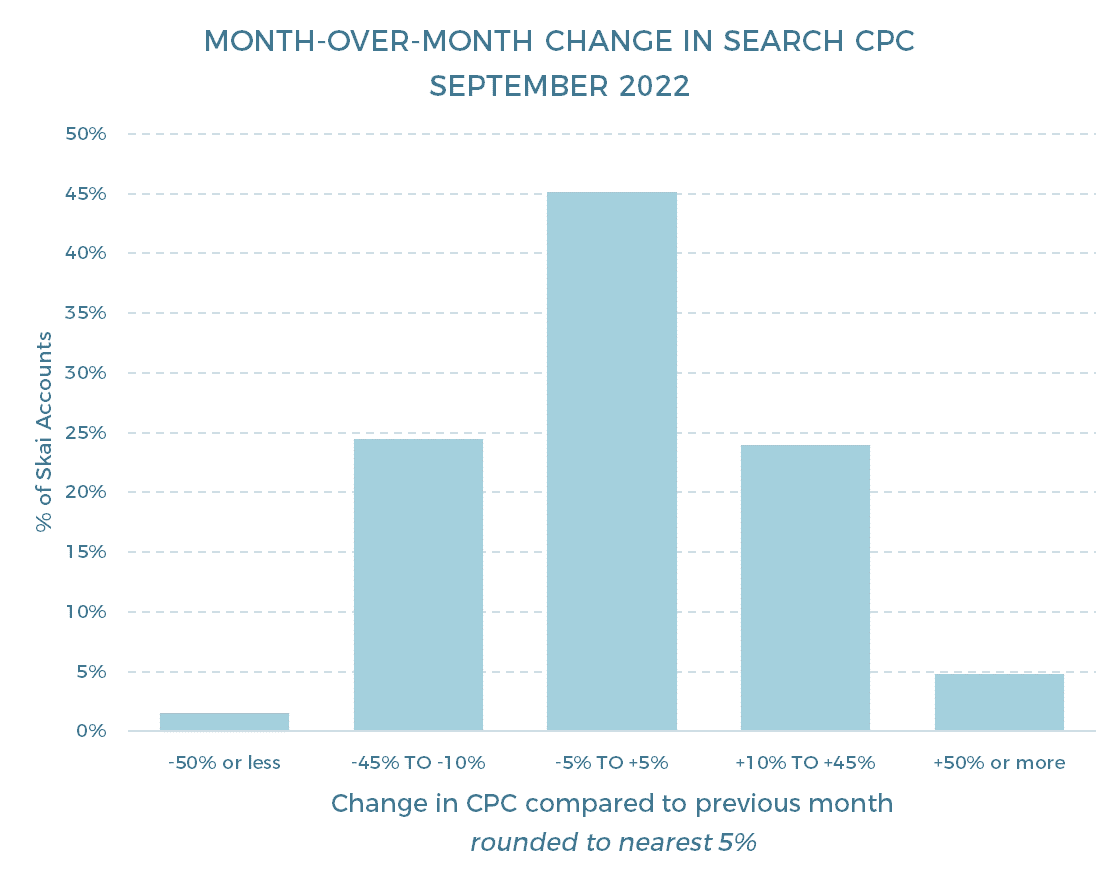
Overall, the average cost of a click in paid search advertising decreased 3% from August to September.
- 29% of paid search accounts paid +10% or more per click in September versus August, compared to 26% who paid -10% or less (+3% differential)
- 5% of accounts paid +50% or more per click in September versus August, compared to 2% of accounts paying -50% or less (+3% differential)
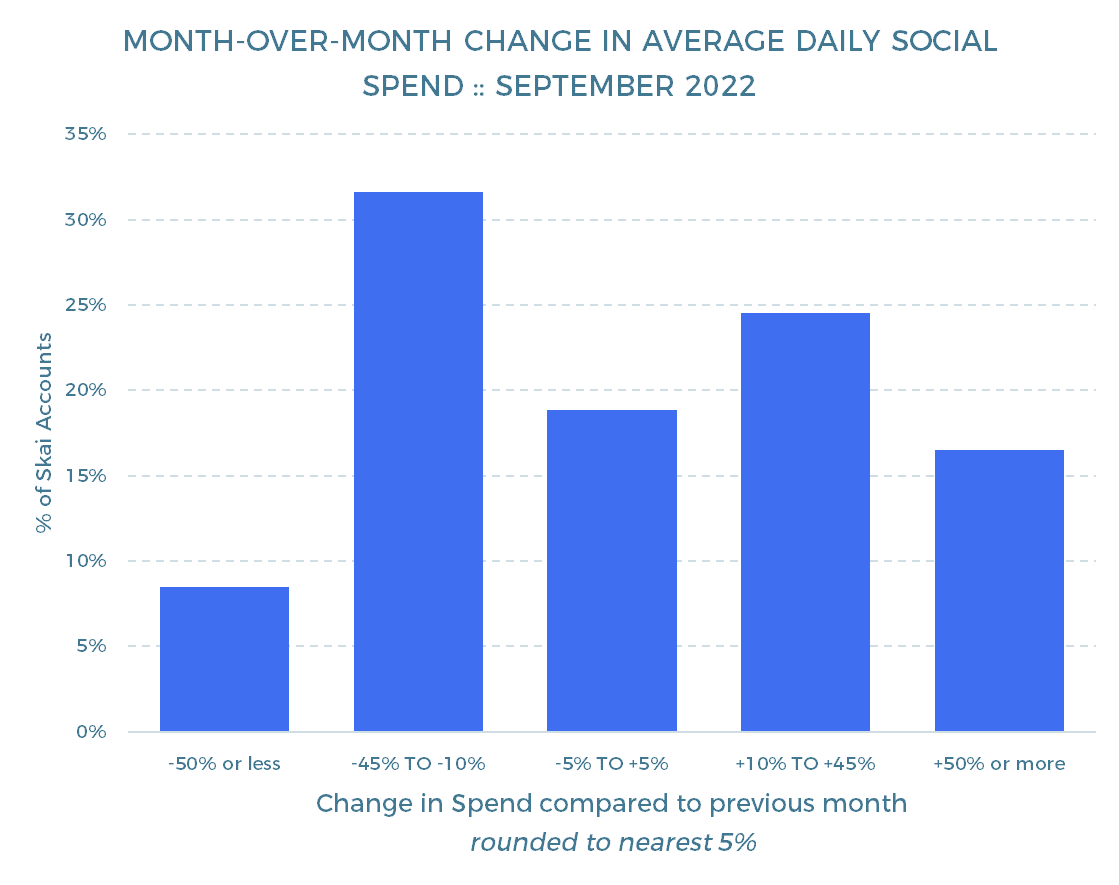
Social Advertising spending
Overall, average daily spending in social advertising increased 13% from August to September.
- 41% of paid social accounts spent +10% or more per day in September versus August, compared to 40% who spent -10% or less (+1% differential)
- 17% of accounts spent +50% or more per day in September versus August, compared to 8% of accounts spending -50% or less (+9% differential)
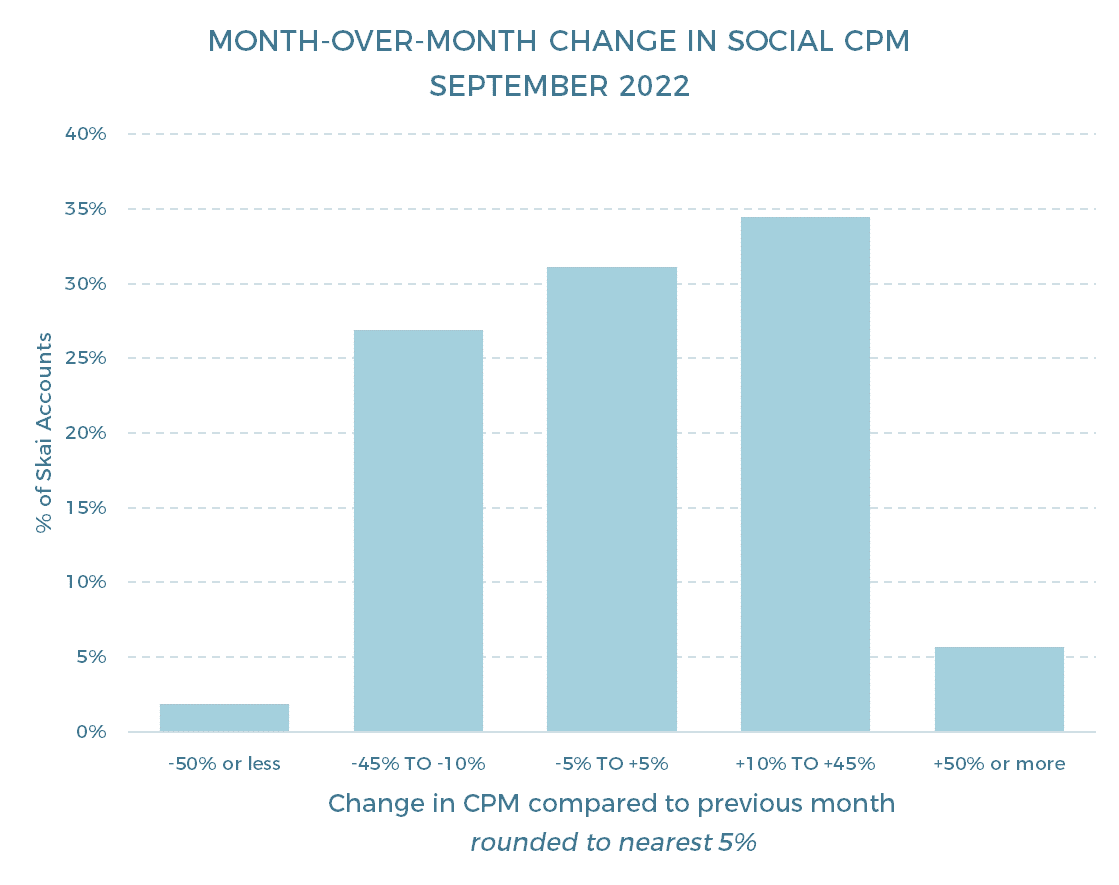
Social Advertising CPMs
Overall, the average cost of a thousand impressions in social advertising rose 10% from August to September.
- 40% of paid social accounts paid +10% or more per thousand impressions in September versus August, compared to 29% who paid -10% or less (+11% differential)
- 6% of accounts paid +50% or more per thousand impressions in September versus August, compared to 2% of accounts paying -50% or less (+4% differential)
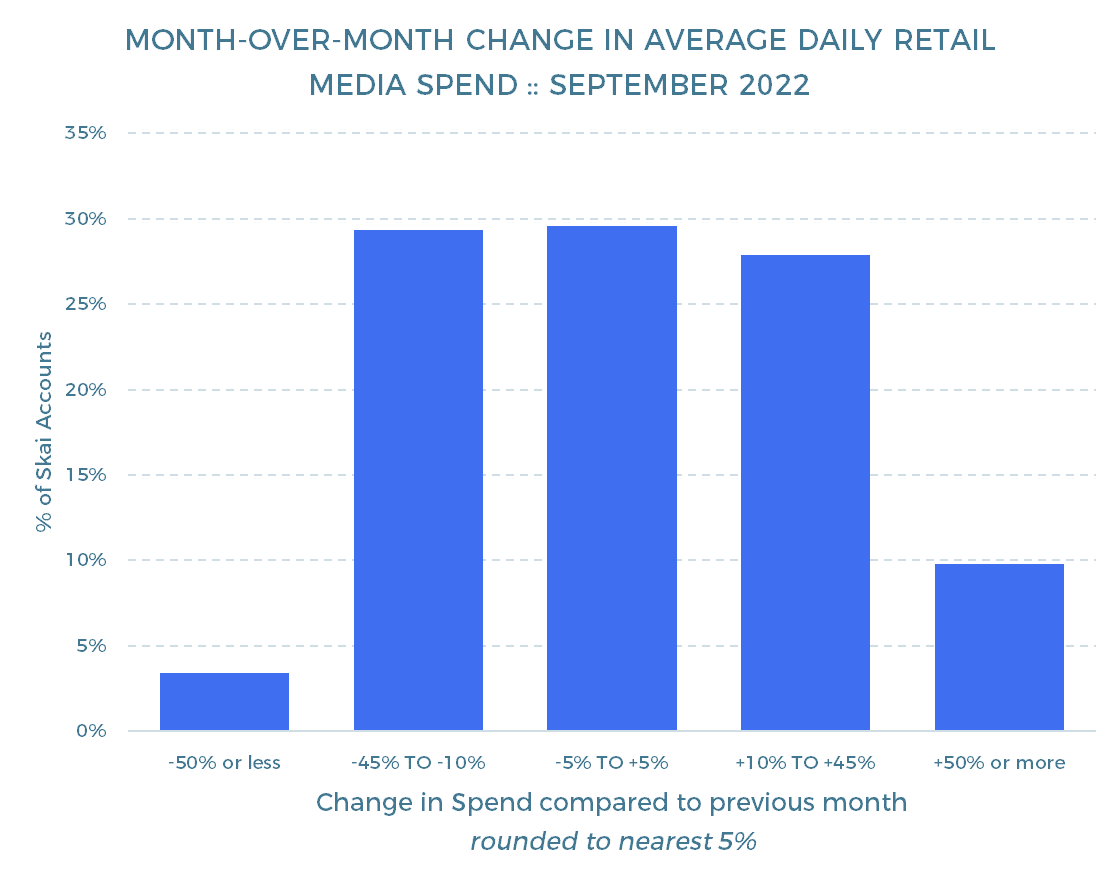
Retail Media spending
Overall, average daily spending in retail media advertising did not change from August to September.
- 38% of retail media advertising accounts spent +10% or more per day in September versus August, compared to 33% who spent -10% or less (+5% differential)
- 10% of accounts spent +50% or more per day in September versus August, compared to 3% of accounts spending -50% or less (+7% differential)
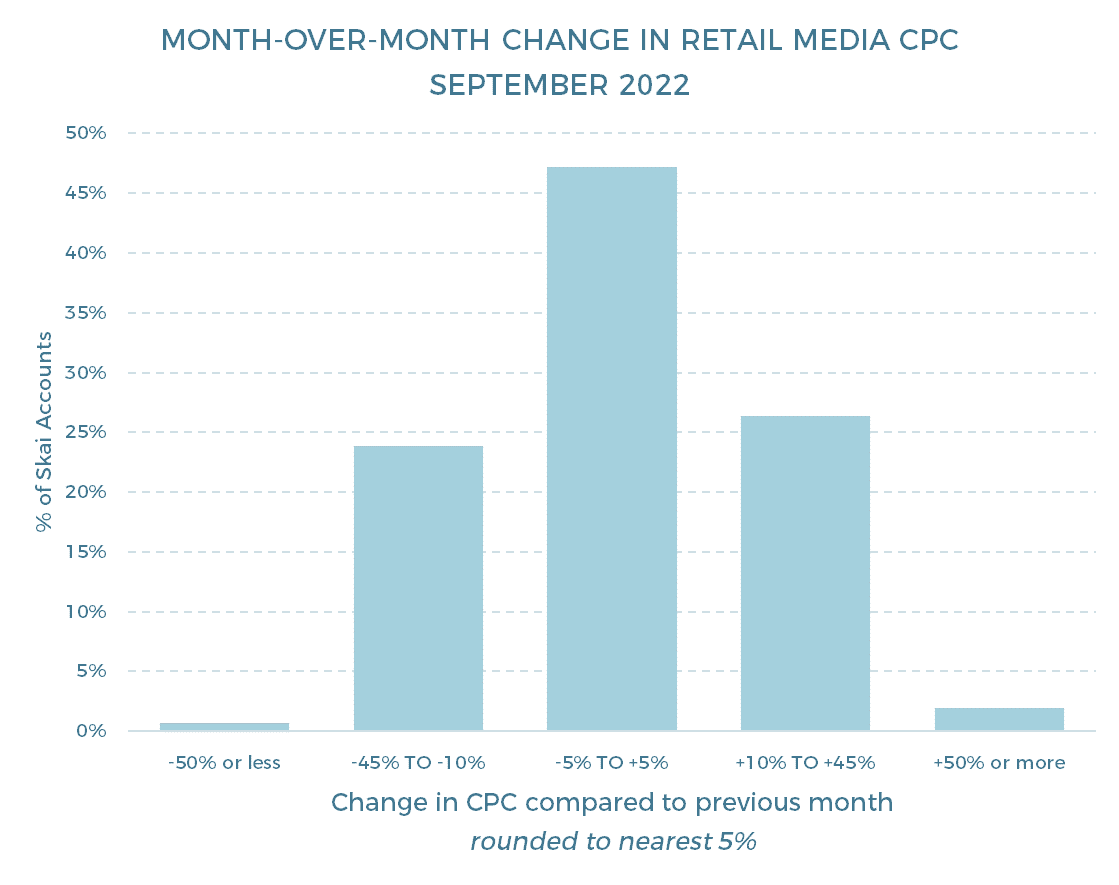
Retail Media CPCs
Overall, the average cost of a click in retail media advertising decreased 1% from August to September.
- 28% of retail media advertising accounts paid +10% or more per click in September versus August, compared to 24% who paid -10% or less (+4% differential)
- 2% of accounts paid +50% or more per click in September compared to August, versus 1% of accounts paying -50% or less (+1% differential)
Check out more resources from Skai
Come back next month for the most up-to-date data. Until then, you can dive into more of our research via our Quarterly Trends Reports hub.
And please visit the Skai blog and Research & Reports page for ongoing insights, analysis, and interviews on all things related to digital advertising.