With 2014 around the corner, we’re counting down the top 5 blog posts of 2013 based on total page views. We’re looking forward to sharing more helpful content with you in the new year so be sure to subscribe using the form on the right to receive all the latest updates. Thanks for reading the Skai blog! Note: This post originally ran on Dec 2, 2013.
Fresh from the oven, we just got our first look at paid search performance for the retail vertical last week. As expected, this year’s Thanksgiving and Black Friday were hot dates for online marketers utilizing paid search to cook up holiday shopping season sales and revenue.
Overall, retailers spent 27% more this year on paid search advertising during these two days, fueled by a 33% year-over-year (YoY) increase in Thanksgiving spend (and a 21% YoY budget lift for Black Friday) with the biggest day in online shopping, Cyber Monday, still not yet in the books. Per Skai data, Cyber Monday last year saw a 51% lift in YoY paid search ad spend from 2011.
“Thanksgiving and Black Friday are two of the biggest shopping days and this year both consumers and advertisers had their wallets ready,“ said Aaron Goldman, Skai CMO. “Skai saw dramatic increases in paid search ad spend and online sales revenue on these two days signifying the peak shopping season is off to a hot start. With the 2013 calendar condensing the time between Thanksgiving and Christmas, we expect the torrid pace to continue.”
Multi-device activity explodes in 2013
The biggest eye-popping growth was in Phone and Tablet activity with spend, clicks, and revenue in 2013 across those devices representing a much larger share of the pie than in 2012.
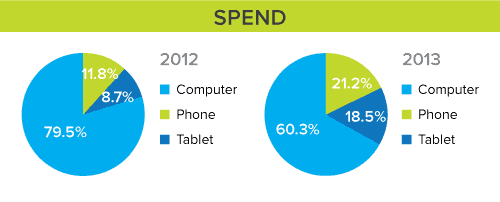
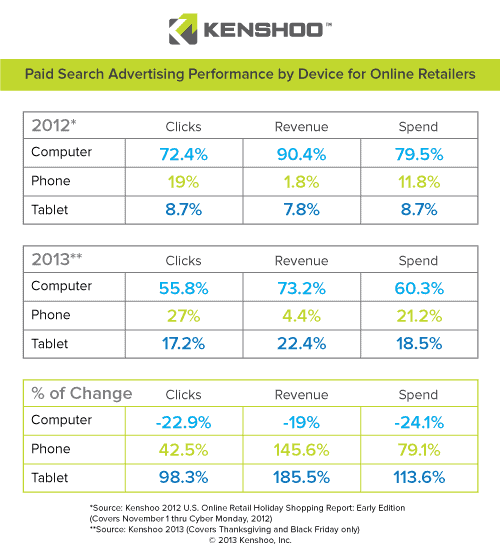
For example, in November 2012 through Cyber Monday, marketers spent 79.5% of their paid search budgets on Computers (i.e. laptops, desktops, notebooks, etc.) with just 11.8% going to Phones and 8.7% to Tablets. This year, the rate of change is astounding. Although paid search advertisers continued to spend a majority of their budgets on Computers in 2013, they dropped it by 24.1% YoY to just 60.3% of total spend for Thanksgiving and Black Friday.
Phone budgets grew by 79.1% YoY to 21.2% of total paid search spend while Tablets grew a whopping 113.6% YoY to 18.5% of total paid search spend.
“It’s clear that the story of the shopping season to date is the mobile migration,” added Goldman. “In fact, this isn’t just a migration we’re seeing, it’s a full on revolution. With phones and tablets accounting for nearly 40% of all paid search ad spend on Thanksgiving and Black Friday, it’s clear marketers have multi-device strategies in place to lure consumers wherever and whenever they’re shopping.”
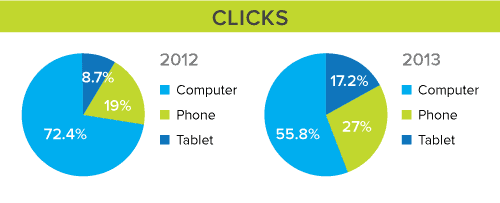
It’s no surprise that click volume followed suit with just 55.8% of all paid search clicks in 2013 going to Computers. Phones (27% of total clicks) and Tablets (17.2% of total clicks) represented almost half (44.2%) of all paid search clicks on Thanksgiving and Black Friday.
To put that in perspective, mobile devices only made up 27.7% of all paid search clicks in November 2012 and just 14.5% during the 2011 holiday shopping season.
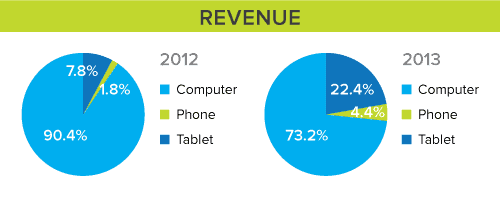
However, even though clicks and spend migrated heavily over to mobile devices, the Computer was still tops in terms of revenue – but not as strong as it was last year. In November 2012, around 9 out of every 10 dollars (90.4% of total) in revenue generated by paid search originated from Computers. For 2013 Thanksgiving and Black Friday, just 73.2% of all revenue came from Computer with 26.8% coming from mobile devices (22.4% from Tablets and 4.4% from Phones), which is an increase of 176% to mobile devices!
Look for Skai’s Cyber Monday report this week which will include a more in-depth recap of the entire holiday shopping weekend. It’s important to note that these numbers should be interpreted directionally as they draw upon different data sets and advertiser samples. See below for full methodology. We always encourage marketers to analyze their own campaigns against their key business metrics to identify the most meaningful benchmarks.
Methodology
The data analyzed by Skai reflects a representative cross-section of Skai clients (advertisers and agencies) managing paid search programs for the retail vertical with active campaigns tracking impressions, clicks, conversions and revenue on Thanksgiving and Black Friday in 2013. This index includes all major retail categories such as, but not limited to, electronics, books, apparel, appliances, shoes, sporting goods and more. For the YoY ad spend comparisons, the client sample and dates analyzed were identical in 2012 and 2013. This data set covers over 1 billion paid impressions on search engines like Google, Yahoo!, and Bing that delivered more than $100 million dollars in online sales revenues.
For the YoY mobile device comparisons, the 2012 by-device numbers reflect November 2012 through Cyber Monday for a subset of Skai retail clients. The 2013 by-device numbers reflect Thanksgiving Day and Black Friday only for different subset of Skai retail clients. The variances in dates and samples are due to differences in tracking mechanisms and campaign structures before and after the migration to enhanced campaigns.
All data is accurate as of December 1st, 2013 but subject to change as delayed conversions are added in subsequent days. Final figures will be released in the full Skai 2013 Online Retail Holiday Shopping Report, available in early January 2014.


