Watch the Skai Q3 2018 Quarterly Trends Report webinar or download the webinar slides. You can also visit our interactive QTR infographic page to further investigate Q3 2018 data. Great for slides and client presentations!
Even directionally, industry benchmarks can be extremely valuable to marketers who wish to add context and better understand their recent campaign performance. If your paid search costs are falling or you’re wondering if other advertisers are increasing their spend on a particular channel as much as you are, aggregated metrics across a significant sample size of advertisers can help you understand if what you’re experiencing is normal or not.
For years, Skai has published its Quarterly Trends Report to help advertisers make sense of their efforts and better plan their next campaigns. To get the most accurate trend data, you need a very large and comprehensive set of data across a variety of advertiser verticals, marketing channels, and regions. As Skai has grown, so has our dataset which now includes aggregated performance data from Skai advertisers over 15 consecutive months consisting of more than 500 billion impressions, 14 billion clicks and $6 billion (USD) in advertiser spending.
For the Skai Q3 2018 Quarterly Trends Report, Skai’s Senior Director of Marketing Research, Chris ‘Coz’ Costello, analyzed performance data taken from over 3,000 advertiser and agency accounts across 20 vertical industries and over 60 countries. This dataset spans Skai’s publisher partners which include Google, Bing, Pinterest, Snapchat, Facebook, Instagram, and others.
In the webinar, the presentation spanned over 50 slides of analysis covering Search, Social, Mobile, and Ecommerce marketing performance. The following are three “big picture” trends that Coz shared for Q3 2018:
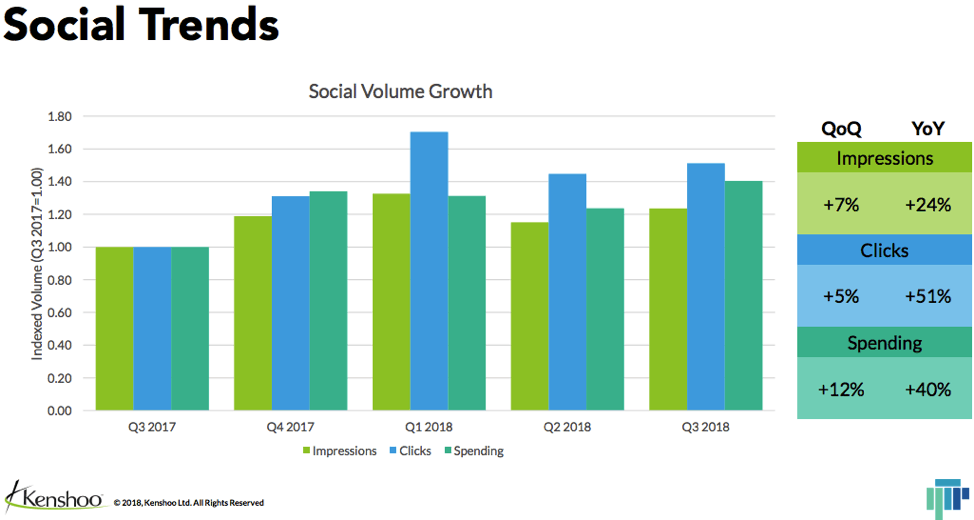
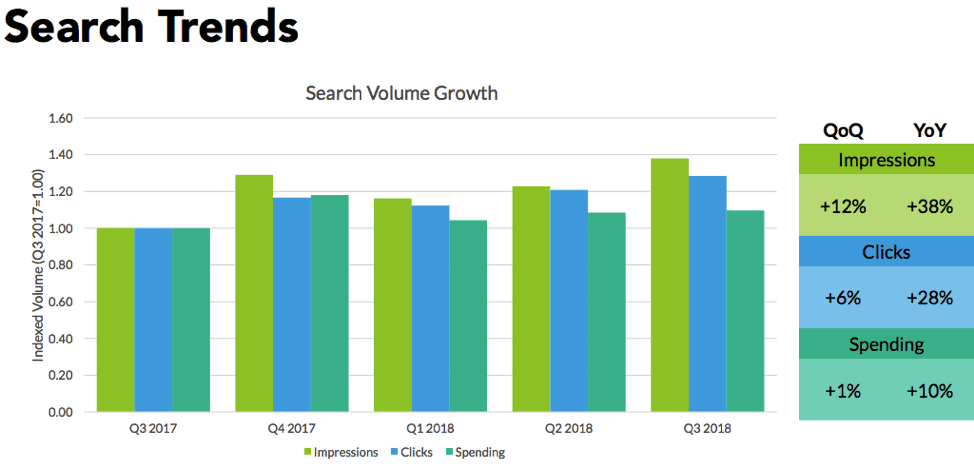
Q3 2018 Big Picture Trend #1 – Core search and social trends are stable as marketers prepare for the fourth quarter. Spending across search and social advertising remained at the same growth rate year-over-year (YoY) in Q3 as the previous quarter (Q2 2018 to Q2 2017). In Q3 2018, social ad spending was up 40% YoY and search ad spending was up 10% YoY.
Because both channels had the same YoY growth rate in both Q2 and Q3, we have enough stability to provide some strong predictor signals for Q4 of this year. Last year, Q4 spending was up 34% from Q3 in social and up 19% in search. With these channels already up double digits in total spend from last year, comparable quarter-over-quarter (QoQ) increases would mean Q4 2018 would be the biggest quarter in the history of both channels.
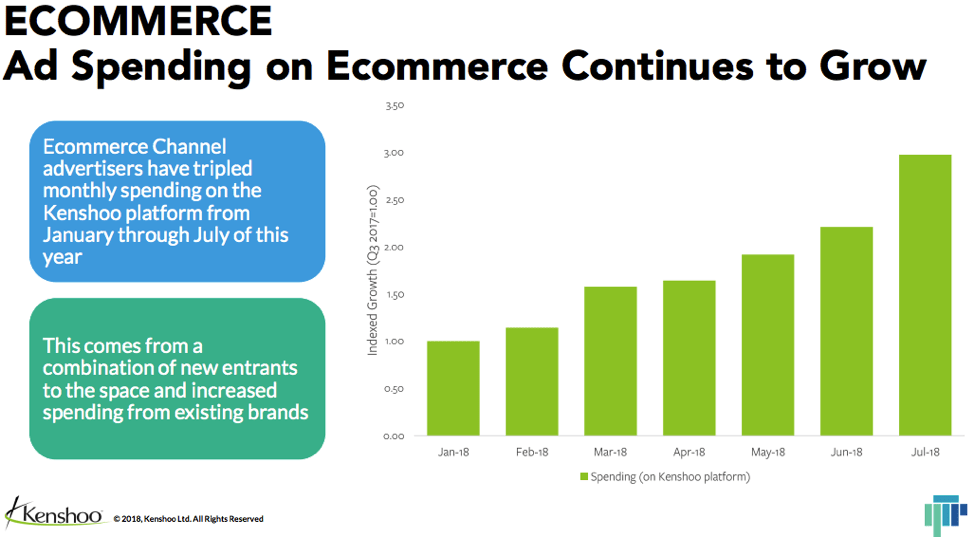
Q3 2018 Big Picture Trend #2 – Newer entrants to the digital marketing space such as ecommerce shopping ads (ECA) and Pinterest have established themselves and made a strong case for their value to marketers. Shopping ads in the search and social channels have become strong choices for retailers over the years. The relatively newer ecommerce channel ads (ECA) offer an ad experience that is different than the search and social ads because they can reach consumers while actively shopping inside an online store. In 2018, these unique ads have grown tremendously and have tripled in advertiser spend from January to July.
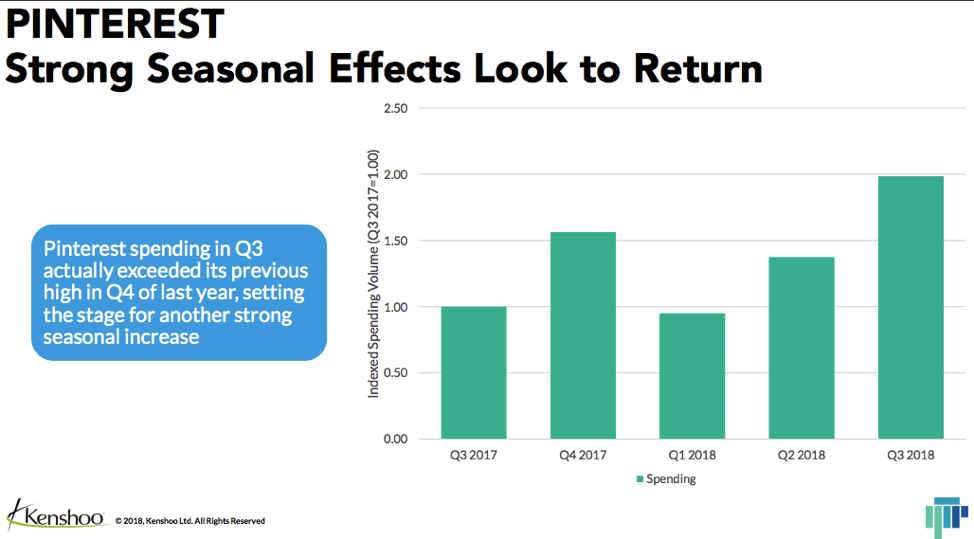
Another fast-growing publisher in digital marketing is Pinterest, which doubled spend YoY in Q3 2018 from Q3 2017. One of the interesting points that Coz highlighted during the webinar was that spending in Q3 2018 on Pinterest was higher than it was in Q4 2017. With a 56% quarter-over-quarter jump from last year’s Q3 to Q4, this data indicates that Q4 2018 is going be a huge quarter for the publisher.
Conventional wisdom dictates that marketers “vote” with their wallets, which means that Pinterest has been impressing advertisers as of late and should continue during this year’s holiday shopping season.
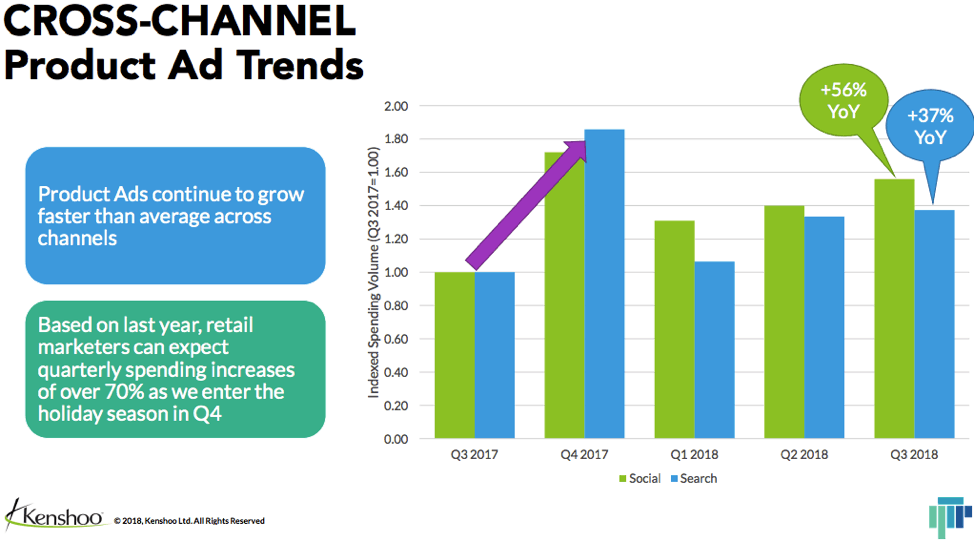
Q3 2018 Big Picture Trend #3 – Adoption and growth of product-oriented ads across paid search and paid social publishers delineate the essential pillars for digital marketers heading into the Q4 holiday season. What this means is that spending on shopping ads on search and social are growing faster than the channels themselves.
- Search shopping ads spending grew 38% YoY in Q3 versus 10% YoY for the total search channel
- Product ads for social spending increased 56% YoY in Q3 versus 40% YoY for the total social channel
Marketers are seeing a high return on shopping and product ads across search and social and are finding ways to funnel more of their budgets to those formats. This is yet another indication that the retail-heavy Q4 shopping season could be huge this year with retailers gearing up for the most critical quarter of their year.
These are just a few of the key trends from Q3 2018. To get the full picture of what happened last quarter watch the webinar. Coz brings the quarterly trends to life with smart and humorous color commentary to help you make the most sense of this extensive $6 billion marketing performance dataset across 3000+ advertisers.
You can also go directly to our Quarterly Trends Report snapshot page to engage with our helpful, interactive infographic that lets you sift through our immense dataset to find the benchmarks that are most meaningful to you.
