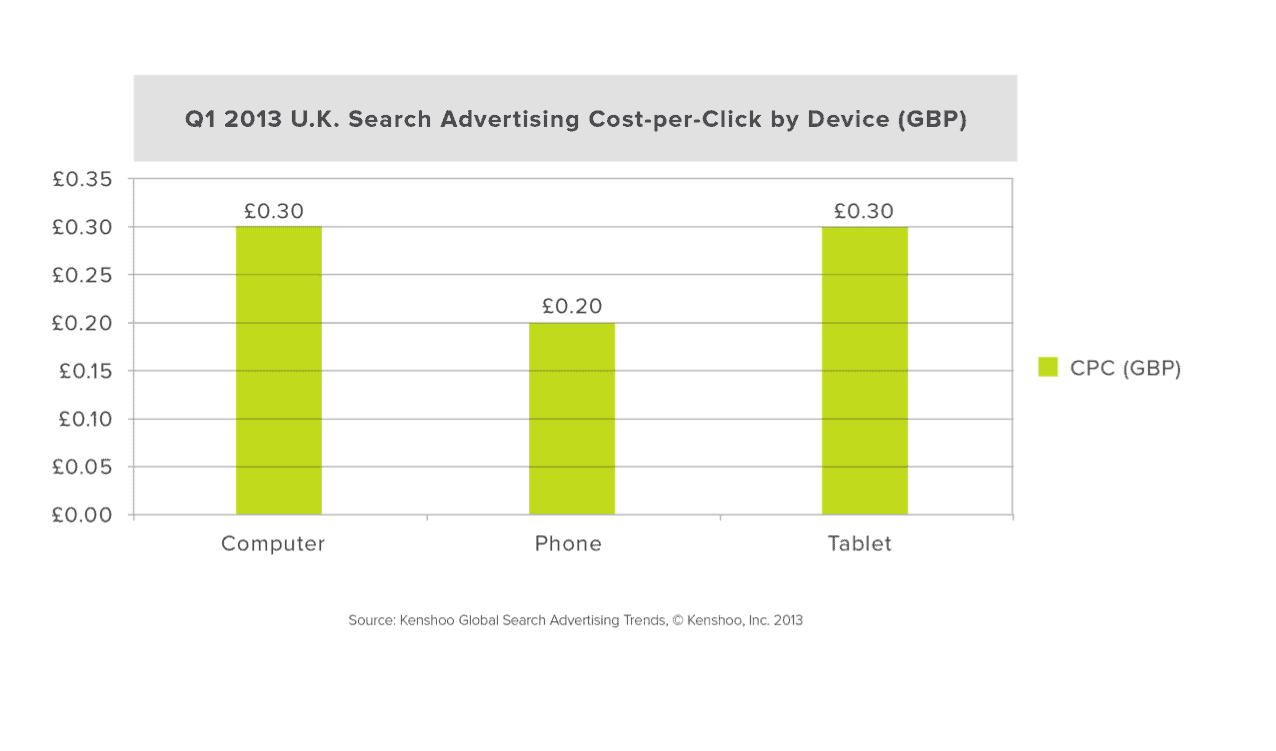
Thank you for following this multi-day coverage of Global Search Advertising Trends Q1 2013 report. In this final post, we will take a look at how devices performed in the U.K. during the first 3 months of this year. Don’t foget to join me for the webinar tomorrow, (Tuesday, April 30th) where I will present all of the charts and data from the report as well as some some actionable insights suggested by the data.
As expected, clicks and spend on computers (72.3% and 75.5% respectively) made up the majority of activity in the U.K. in the first quarter of 2013. However, whereas clicks and spend to mobile devices in the U.S. accounted for less than 20% of the total paid search activity, in the U.K., phones and tables represented 27.8% of total clicks and 24.5% of total spend!
The click-to-spend ratio for tablets was very close with 16.3% of total clicks and 16.7% of total ad spend. However, phones — which made up a healthy 11.5% of clicks — only accounted for 7.8% of paid search ad spend.

