Welcome back! With the first three months of 2013 in the books, it’s time to take a look at how devices performed in our Global Search Advertising Trends Q1 2013 report. Don’t forget to register for our webinar where I’ll walk through the report and share best practices and insights from this data.
Before we examine the U.S. device breakout numbers, I should clarify that the Skai data presented in the mobile section of the report utilizes a different methodology than the other report sections. As explained within the report as well as in a blog post earlier this week, our goal is to use as much of the data we have from the 1.2 million active campaigns on our platform without introducing skew from advertisers onboarding in the middle of the 24-month analysis period. We used a different subset of aggregate client data for device insights than we did for our global analysis. There’s still a great deal of data here, but this explains why you may see some statistical differences in the device sections versus the rest of the report.
With Enhanced Campaigns bringing so much recent attention to mobile paid search, there has been quite a bit of interest in how different devices are being managed by search marketers. In the U.S., paid search activity on computers still made up a majority of the clicks (81.2%) and spend (86.1%) in the first quarter of 2013. Interestingly though, whereas tablets barely beat out phones in clicks (10.1% vs. 8.7%), spend on tablets (8.9% of total search budgets) was almost twice as high than with phones at just 5% of U.S. paid search budgets.

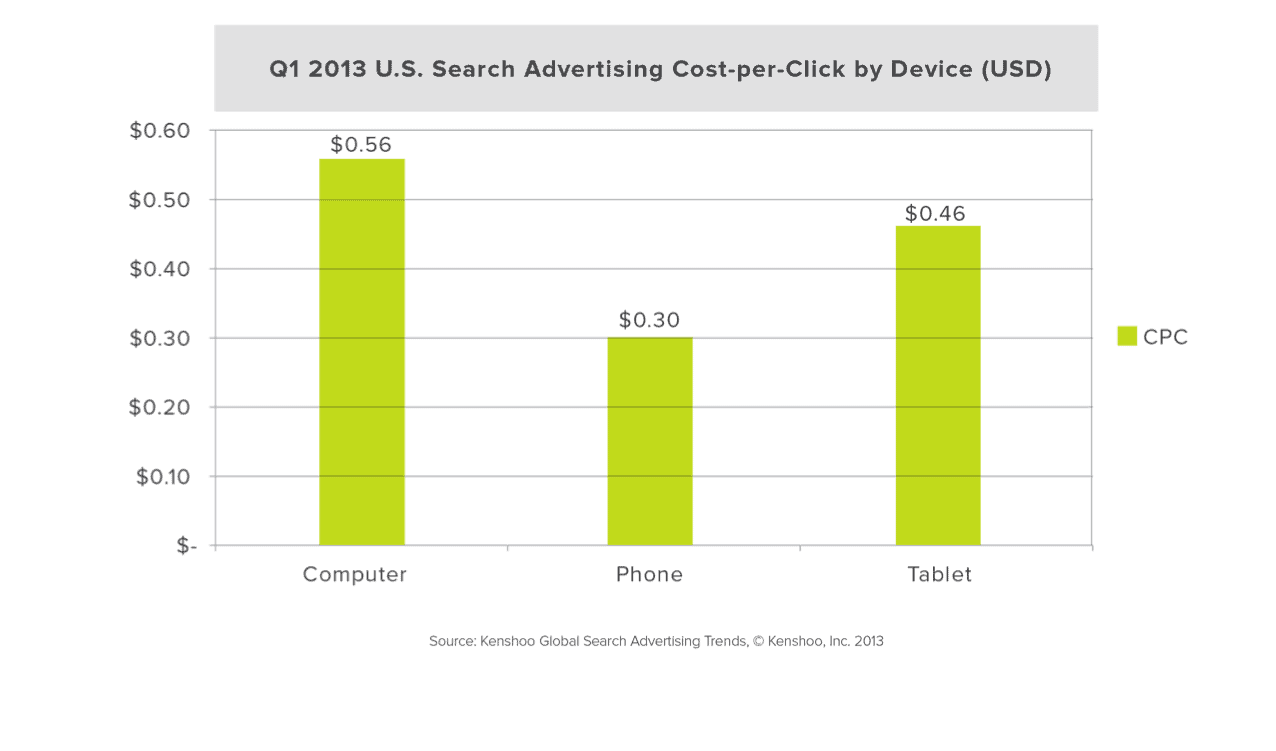
This clicks-to-spend ratio discrepancy is primarily due to the average cost-per-click of just $0.30 on phones compared to 53% higher on tablets at $0.46. It seems that marketers had a bigger appetite for clicks on tablets than on phones in Q1 but ended up paying more for them as well. Computers are still the premium, at an average of $0.56 during the first three months of 2013.

In my next post, we’ll hop across the pond and see how the device breakdown in the U.K. compares to the U.S.
