
As you probably know, 2016 was a big year for mobile apps on Facebook with the release of a few game-changing optimization tools for mobile app advertisers including:
- Worldwide Targeting
- In-App event optimization
- Extended conversion window
- Placement Optimization
- And much more…
Why do we consider these tools game-changing? Well, when employing them, our clients saw significant increases in performance by dropping the price-per-action (in-app) and increasing user quality, all while maintaining scale.
Challenging Our Understanding of Optimization
That said – from an analytical standpoint – some of these new options challenged our understanding of how best to optimize, measure and report. To make my point, I will focus on two of these tools — Worldwide Targeting and Placement Optimization.
In the past, advertisers would separate ad sets by country and placement. This made it easy to analyze and optimize. For example, it enabled advertisers to easily compare the performance differences between these three buckets of ads:
- Instagram ads in the US
- All ads in the US
- All Instagram ads
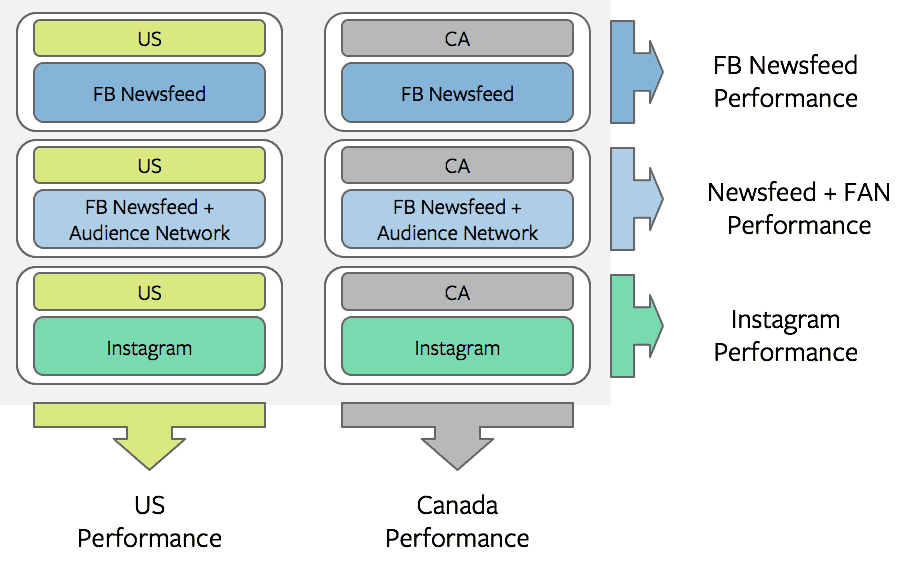
But when Facebook introduced Worldwide Targeting and Placement Optimization, it made it possible to transition to a “single bucket” strategy where all ad sets could be merged into one and then optimized automatically.
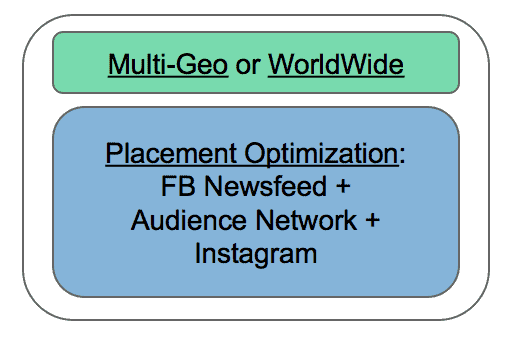
Why Does “Single Bucket” Optimization Work so Well?
In a nutshell – although you pay for impressions when using oCPM, Facebook’s algorithm tries to optimize towards the optimization event that you have selected (either install, or an in-app event). A simple way of explaining how this works is that Facebook sorts your audience by their likelihood to perform that event. If you break your audiences into separate countries you will exhaust the “very likely” users quickly in every country of your selection and then start serving the less valuable users. With Worldwide Targeting, Facebook can tap into inventory across 250 countries (minus the ones you excluded) to find the users that are likely to convert for you.
Also, Facebook’s algorithm can optimize the placement on a user level as well, identifying users that are likely to perform the optimization event when served on their Facebook Newsfeed vs those that are more likely when served in their Instagram feed. This optimization eliminates unnecessary and costly impressions that you would pay for if you allowed Facebook to serve ads to the audience in specific Placements.
Overall, Placement Optimization and Worldwide Targeting give Facebook a lot more “wiggle room” to optimize better.
Taking Optimization to the Next Level
Updating to use one ad set for multiple geos and placements raises two questions:
- Do I need to analyze the individual countries and placements within this ad set?
- If so – how?
Let’s start with the answer to the first question. It’s easy – YES, you do. Because you have an option to exclude countries from your Worldwide Targeting, and sometimes the countries you exclude make a HUGE difference in the overall performance of your campaign.
Unfortunately, the second question isn’t quite as easy to answer. While Facebook allows you to breakdown the data in different ways, including by country and placement, you won’t typically have the full picture since you’re likely relying on your Mobile Measurement Partner (MMP) for your event tracking and revenue attribution.
ONLY Consolidating the MMP breakdowns into every single Facebook breakdown enables a full scale analytical view. This will enable you to analyze the spend breakdown from Facebook against the revenue breakdown from your MMP.
A Worldwide Targeting Example
As an example – in this case the advertiser used Skai Gaming’s 3 Dimensional Pivots to analyze all the Worldwide Targeting ad sets, broken down by countries in the rows – showing a single country per row, with a Side-By-Side view of iOS vs Android.
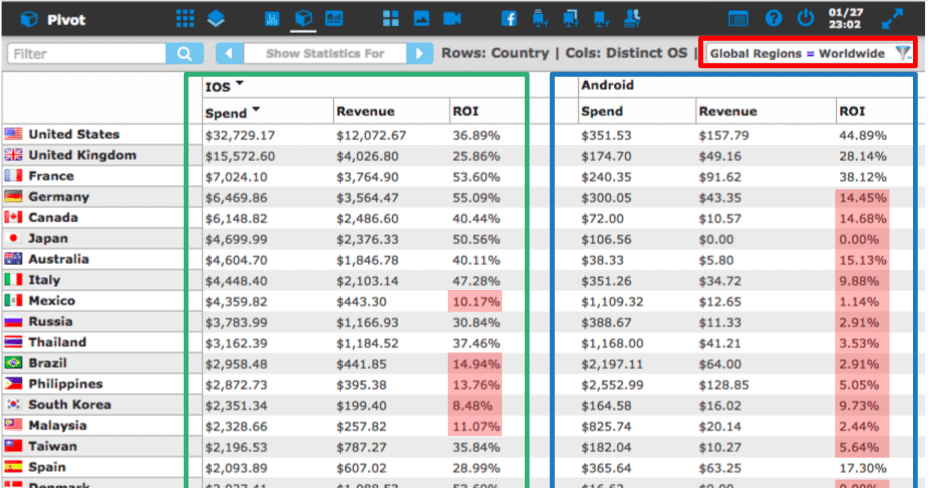
Note – the above analysis is sorted by iOS spend
As expected, the ROI columns show a lot of variation. The advertiser applied a 15% ROI threshold in the filter and so all of the countries that were sub 15% ROI for every Mobile OS are highlighted.
From this report, you can determine that 30% of the budget is responsible for ONLY 1.6% of the revenue. This isn’t a fair trade if you ask me. Excluding all those countries from the ad set will force Facebook to re-distribute that budget to other countries. A full THIRD of the budget will be re-distributed to countries with dramatically higher ROI.
A Placement Optimization Example
Here’s another example – in this case for the placement – or more accurately – the Publisher Platforms from the placement attributes:
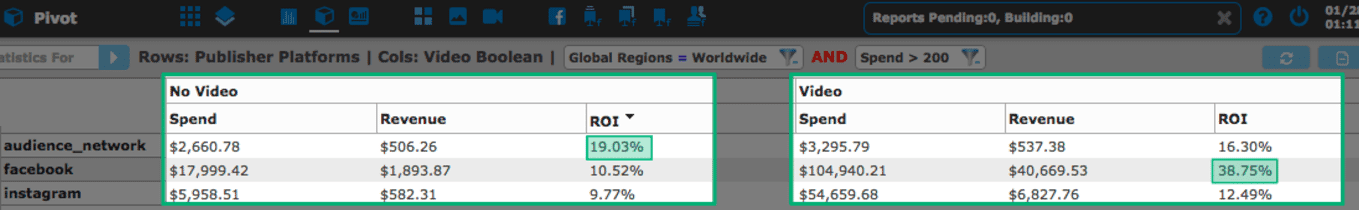
In this case – the highlighted values reveal that image creatives have almost a 2X ROI in the Facebook Audience Network (FAN), but volume is low, versus the Videos that see their success in the Facebook Newsfeed.
This specific product hasn’t found a way to crack Instagram with the current creatives. What actions can the advertiser take?
- They can separate the image ads and video ads into different ad sets, then use the Facebook Bid Multiplier for FAN on the image ads to increase the volume coming from the audience network. Ultimately – this should increase the ROI and show a lift in the overall performance.
- As Instagram is currently showing poor performance – in the short term – they can exclude Instagram until they find the creatives that perform best.
By digging into their data and making all of these modifications, this advertiser saw a staggering 19% increase in their 30 day ROI.
The Key to Success
Analyze your breakdowns. The key to your success is hidden within the targeting. This insight can lead to exclusion of low performing countries and placements – and forcing Facebook to re-distribute the budget to better performing ad sets.
Please CONTACT US if you’d like help optimizing your mobile app advertising or with any of the above strategies. We’d love to partner with you.