Skai’s Q1 2026 Digital Advertising Trends Report shows marketers are increasing investment in retail media, paid social, and high-intent search despite economic uncertainty. Retail media spend rose 27% as CPCs declined across every category, paid social delivered major efficiency gains, and Amazon DSP’s lower CPC than Sponsored Products signals a major shift in media planning. As AI-driven shopping grows, brands also need stronger product data and multi-retailer strategies to stay competitive.
Q1 data is the reveal. It’s the first look at how marketers are actually executing the annual plans they built last fall: the strategic bets, the format shifts, the retailer diversification conversations that happened during planning season. All of it shows up in the Q1 numbers.
And what those numbers say is clear. In a macro environment where 9 in 10 ad buyers told the IAB they’re worried about tariff impacts and recession odds sit at 1 in 3, marketers didn’t hedge on retail media. They expanded. Spend jumped 27% year over year, clicks surged 38%, and CPCs fell 8%. Paid social quietly posted the strongest efficiency numbers of any channel. And paid search, despite record costs, showed disciplined pruning rather than retreat.
Drawing from over a trillion impressions, nine billion clicks, and billions in spending across retail media, paid search, and paid social, this quarter’s analysis captures what conviction looks like when it meets market reality.
Upper funnel used to be the expensive play. Not anymore.
Retail media’s Q1 headline isn’t the 27% spend growth. It’s a pricing shift that would’ve been unthinkable twelve months ago.

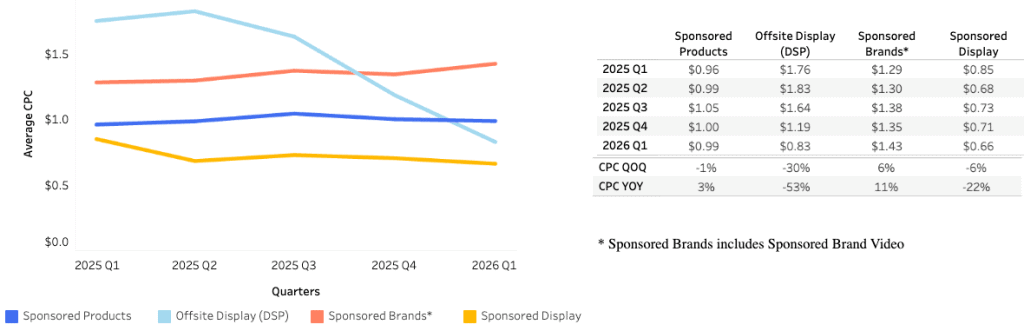
DSP now costs less per click than Sponsored Products on Amazon. In Q1, DSP came in at $0.86, compared with $0.96 for Sponsored Products. A year ago, DSP ran nearly twice as much. And DSP clicks grew 156%, the most dramatic cost-to-volume shift across any format on any platform this quarter. If your team is still budgeting DSP as the premium experimental line item, the math has completely inverted.
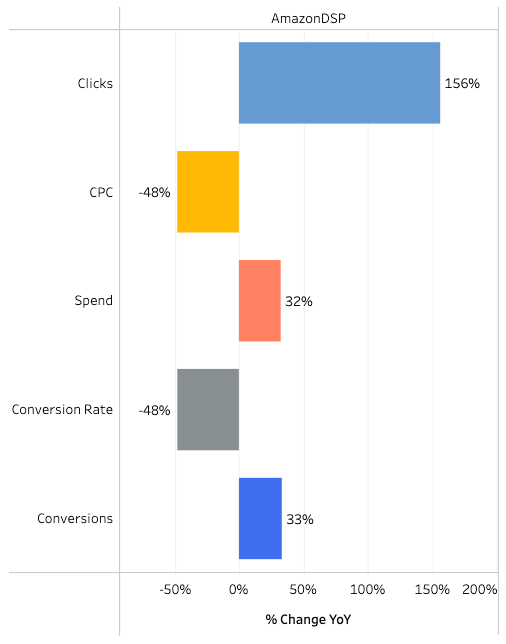
That efficiency extended well beyond Amazon’s DSP. For the first time in our data, CPCs declined across all retail media categories. Not most of them; all of them: Beauty, Health, Electronics, Apparel, and Food. When that kind of broad-based cost relief shows up, it creates a window for testing new retailers, new formats, and new categories at lower risk. Q1 is when the best programs run those experiments. They settle in by Q2, build repeatable systems through Q3, and scale hard for Q4.

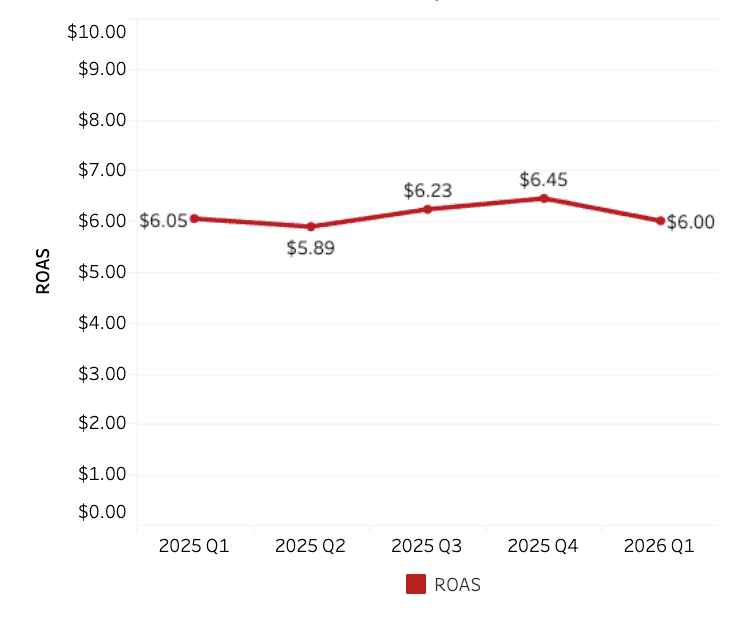
Meanwhile, ROAS held at $6.00 for a fifth consecutive quarter of rising spend. Think about what that means. Budgets keep climbing, and returns keep holding. Retail media has now resisted the diminishing returns curve for over a year of aggressive investment. That kind of durability is rare across any digital channel.
The diversified portfolio case just got harder to argue against
One of the more interesting developments in Q1 is that each tier of the retail media ecosystem earned its budget growth for a completely different reason.
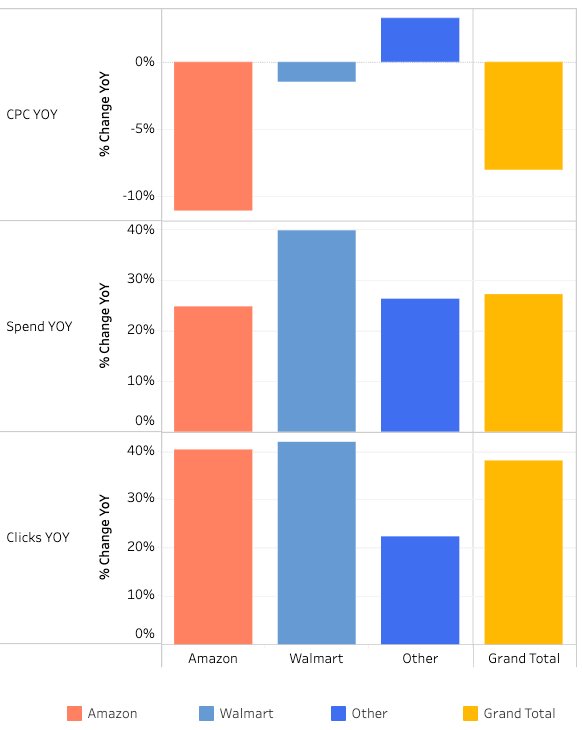
Amazon delivered 40% click growth with CPCs down 3%. It’s the volume play. Walmart grew spend 30%, with the steepest CPC decline among the major platforms, sharpening its case as the value option. Emerging retail media networks attracted 41% more spend by competing aggressively on price to win share.
This is meaningful for how you plan. A year ago, the conversation was often about consolidating toward the biggest platforms for scale and simplicity. Q1’s data suggests the smarter move is a portfolio approach where each retailer serves a distinct role: volume, value, or expansion. The brands already running diversified strategies captured efficiency across all three tiers simultaneously.

On Amazon specifically, three of four ad formats now cost under $1.00 per click. Sponsored Display is the only format sitting below its year-ago spending level, and that budget flowed directly to DSP. Sponsored Brands held steady alongside Sponsored Products, a sign that advertisers are protecting their branded search results as category pages grow more competitive.
Paid search is getting more selective, and that’s a good thing
Spend grew 5% while impressions dropped 10%. That’s not a channel in decline. It’s a channel where advertisers get more deliberate about which queries deserve budget.

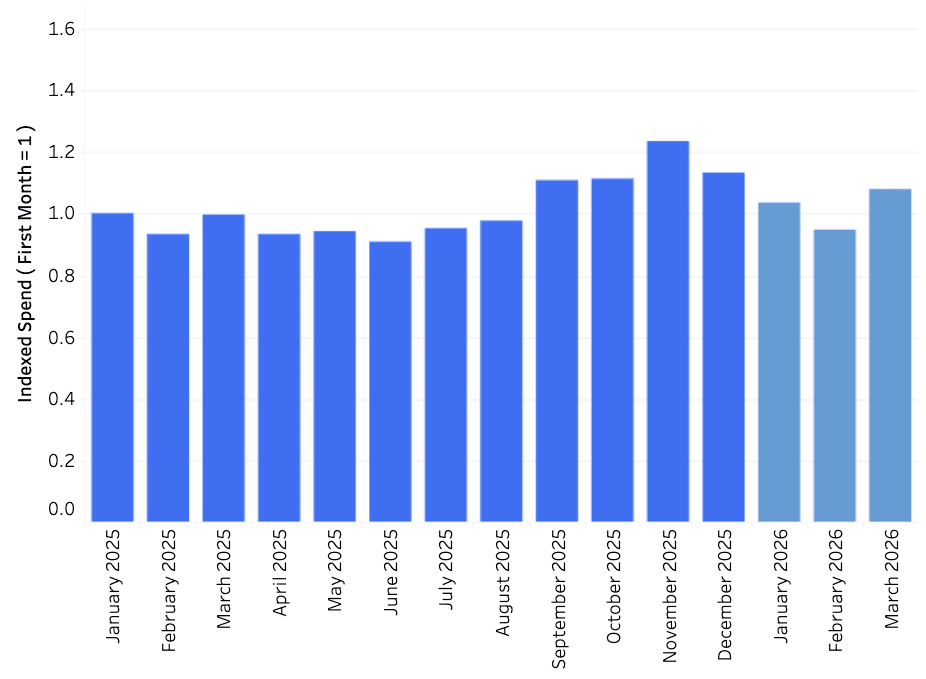
Clicks fell 6% on 10% fewer impressions, suggesting the remaining inventory is earning engagement at a higher rate. CPCs climbed to $1.10, matching Q4’s all-time high. For a metric that barely moved for five years, the acceleration since 2024 has been steep. But the month-over-month story is encouraging: March jumped to 8% year-over-year growth after January (3%), and February (2%) came in nearly flat. Advertisers spent January and February calibrating, then leaned into what worked.
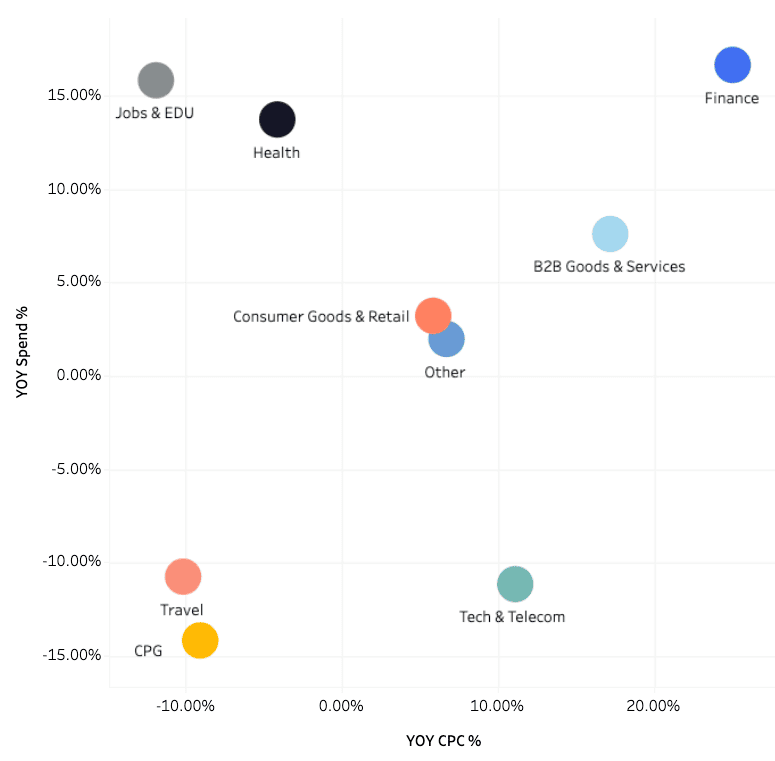
The category picture tells a clear story about where conviction lives. Finance, Jobs & EDU, and Health are investing aggressively, betting that high-intent search queries justify the rising costs. CPG and Travel pulled back by double digits. B2B Goods & Services grew modestly while absorbing 20%+ CPC increases. Where your category sits determines whether this was an expansion quarter or a consolidation one for your search program.
Performance Max spend pulled back from Q4’s holiday peak but remains well above year-ago levels, and CPCs dropped. Worth noting: Google shipped its biggest PMax transparency updates ever in Q1 2026, including channel-level performance reporting, first-party audience exclusions, and budget pacing tools. Advertisers who were hesitant about PMax’s black box now have significantly more visibility into where their dollars go. That should change the adoption calculus for many teams.

Social is delivering quietly while everyone’s talking about search and retail media
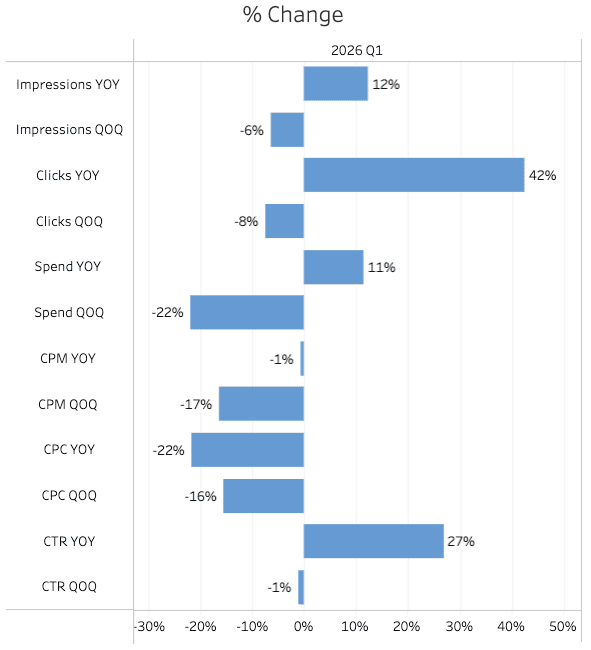
Paid social posted the strongest efficiency numbers of any channel this quarter, and it didn’t get nearly enough attention. Clicks jumped 42% year over year. CPCs fell 22%. CTR climbed 27%. Those three numbers moving in those three directions at the same time are genuinely unusual.
CPMs have settled into a stable $5-$6 range after the volatility that defined 2021 and 2022. That kind of cost predictability is relatively new for social, and it makes budget forecasting significantly more reliable. For brands running omnichannel commerce media programs, knowing what your social reach will cost quarter to quarter lets you plan the rest of the mix with confidence.

TikTok’s spend share climbed to roughly 18%, its highest in five quarters, while account adoption held near 48%. The gap between the number of advertisers on TikTok and the amount they’re spending there is finally starting to close. That’s the shift from testing to real investment.

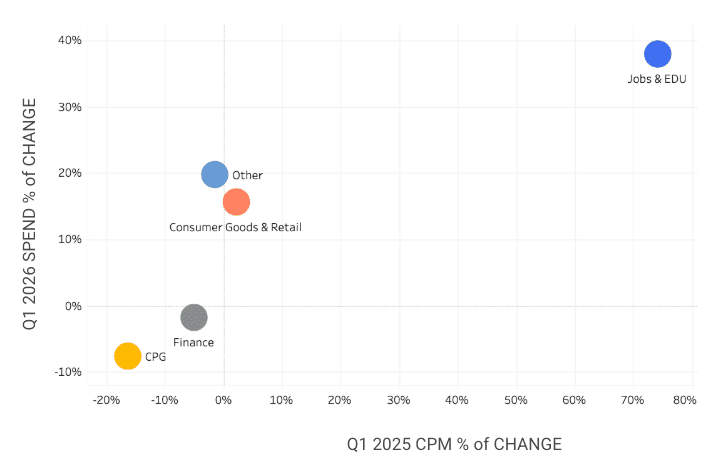
Jobs & EDU stands alone as the category outlier, growing spend 40% while absorbing a 75% CPM increase. That’s a sector making a deliberate bet that social reach is worth the premium right now. The rest of the market is more measured. Consumer Goods & Retail grew 15-20% with modest CPM shifts. Finance held flat. CPG pulled back on both spend and costs, suggesting a cautious posture heading into Q2.
The shopping layer is being rewritten, and retail media is closest to the transaction
45% of consumers are already using AI in their shopping journey, and that number is climbing fast. Google launched its Universal Commerce Protocol at NRF in January with Shopify, Walmart, Target, and over 20 partners. UCP creates a standardized way for AI agents to browse product catalogs, compare options, and complete purchases across retailers. That’s the plumbing for a world where an AI agent, not a human, evaluates your sponsored listing.
During the 2025 holidays, AI-driven interactions influenced $67 billion in global online sales.McKinsey reports that 44% of consumers who’ve tried AI-powered search now prefer it over traditional search. The adoption curves are steep and show no signs of flattening.
What does this mean practically? Product data quality becomes the new competitive moat. AI agents can only recommend what they can parse: structured attributes, accurate inventory signals, and clean pricing data. The brands with that foundation in place across multiple retailers will be the ones visible to AI-mediated discovery. The brands without it will lose visibility before they even know they’ve been filtered out.
Retail media’s proximity to the point of purchase makes it the most important channel to get right in this transition. It’s where the ads live, where the product pages live, and where AI agents will ultimately transact. Full-funnel programs across multiple retailers aren’t just a performance strategy anymore. They’re an AI readiness strategy.
Conclusion: Q1 showed where conviction lives
Q1 2026 delivered a clear picture of what marketers actually believe. Retail media got the biggest vote of confidence, with spend up 27%, clicks up 38%, and CPCs falling across every category. DSP’s pricing inversion below Sponsored Products signals a structural shift in how the funnel should be funded. Paid social posted rare efficiency gains across every metric. Paid search showed disciplined spending with momentum building by March.
Three priorities for the rest of the year. First, rebalance your Amazon format mix to account for the DSP pricing inversion. The allocation assumptions from last year no longer hold. Second, use the broad CPC decline across retail media to expand your footprint while costs are favorable. Test new retailers and categories now, before the window closes. Third, invest in product data quality and multi-retailer presence as the foundation for AI-mediated shopping. The discovery layer is being rewritten, and the brands visible to AI agents will have an advantage that compounds.
Skai is the AI-powered commerce media platform for performance advertising. For nearly two decades, the world’s top brands and agencies have trusted our technology to bring retail media, paid search, and paid social together into a single, strategic commerce media program. With embedded AI, connected data, and automation throughout, Skai helps marketers move faster, make smarter decisions, and drive more meaningful growth.
Ready to see how the platform works? Schedule a quick demo.
Frequently Asked Questions
Retail media grew because it’s delivering better efficiency. Spend rose 27% while clicks increased 38% and CPCs declined, giving brands more room to scale and test.
Amazon DSP now costs less per click than Sponsored Products. That makes upper-funnel advertising more affordable and may change how brands allocate budgets.
AI is changing how consumers discover products online. Brands need accurate product data and strong retailer partnerships to stay visible in AI-driven shopping experiences.
More like this
-

From Software Engineer to AI Engineer: 8 Lessons From Under the Hood at Skai
-

Prime Big Deal Days 2026: How One Month Paid Off in Two Days for Amazon Ads
-

Who Owns AI Agent Strategy Now? Meet the New Buying Committee
-
From AI Assistance to Agentic Execution: Skai’s Take on Amazon Ads unBoxed 2026
-
Ready for AI Agents to Do More? Inside Skai’s 34-Tool Agent Connect Launch
-
The Road to Agentic Marketing: Skai at Amazon Ads unBoxed 2021-2025