
KPIs Across Paid Search, Social Advertising, and Ecommerce Channel Advertising
You may already be familiar with Skai’s Quarterly Trends Report, where we draw upon one of the largest advertising performance datasets in digital marketing outside of the publishers themselves to describe the most important trends in key digital channels. For practitioners, keeping a pulse on the market and understanding what their peers are doing can be helpful to guide their own programs.
To augment those reports, we wanted to take a monthly snapshot that focuses on two questions: Are advertisers spending more this month compared to last month, and are they paying higher prices for their ads?
As with any benchmark information, your mileage may vary, but we hope this provides a bit more context for you as a marketer as you navigate the ups and downs of your program’s performance.
Monthly Paid Media Spend Snapshot – August 2020
Methodology note. For the purpose of these monthly benchmarks, only Skai accounts with spend above a minimum threshold for the previous three months are included in this analysis.


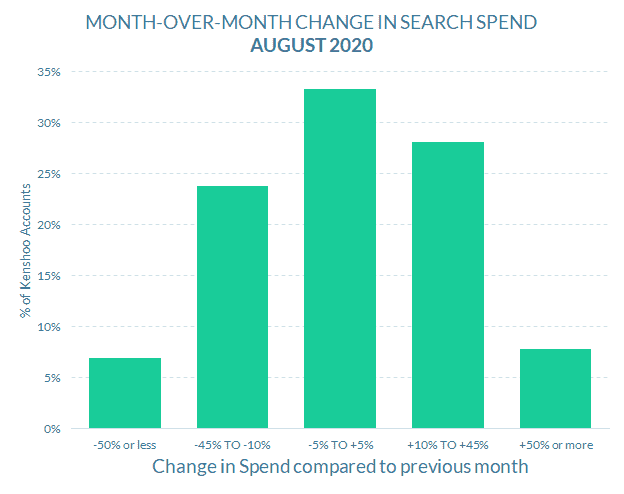
Paid Search spending
Spending was up slightly in August across accounts.
- 36% of paid search accounts spent +10% or more in August compared to July, compared to 31% who spent -10% or less (+5% differential)
- 8% of accounts spent +50% or more in August compared to July, compared to 7% of accounts spending -50% or less (+1% differential)
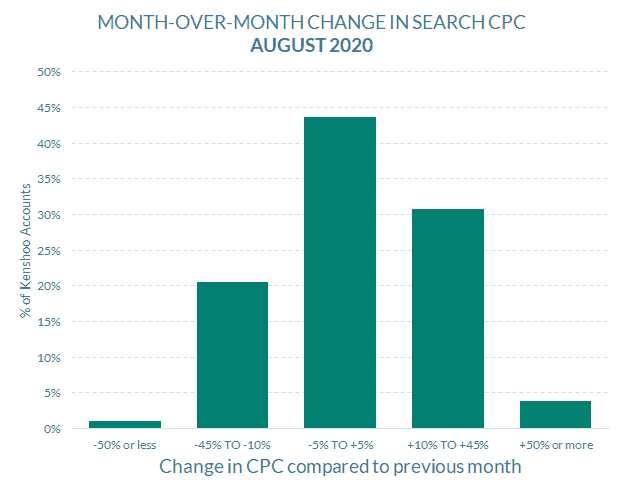
Paid Search cost-per-click
Search CPC increased to a moderate degree with most account CPCs staying within 5% of the previous month’s costs.
- 35% of paid search accounts paid +10% or more per click in August compared to July, compared to 22% who spent -10% or less (+14% differential)
- 4% of accounts paid +50% or more per click in August compared to July, compared to 1% of accounts paying -50% or less (+3% differential)
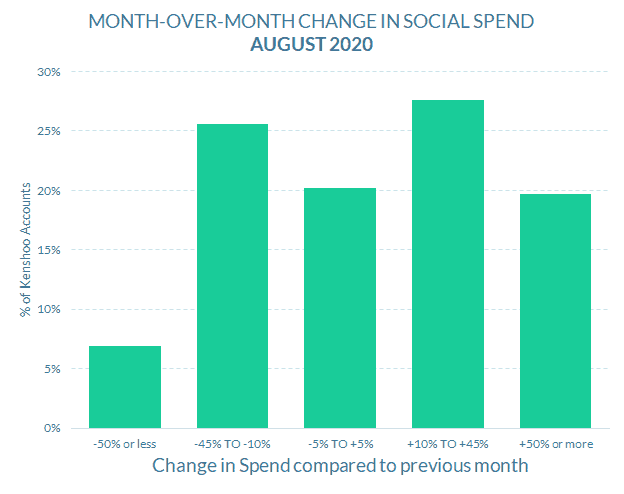
Social advertising spending
The distribution of social spending skewed sharply towards higher social budgets in August, with nearly 50% of accounts spending at least 10% or more compared to July.
- 47% of paid social accounts spent +10% or more per click in August compared to July, compared to 33% who spent -10% or less (+14% differential)
- 20% of accounts spent +50% or more in August compared to July, compared to 7% of accounts spending -50% or less (+13% differential)
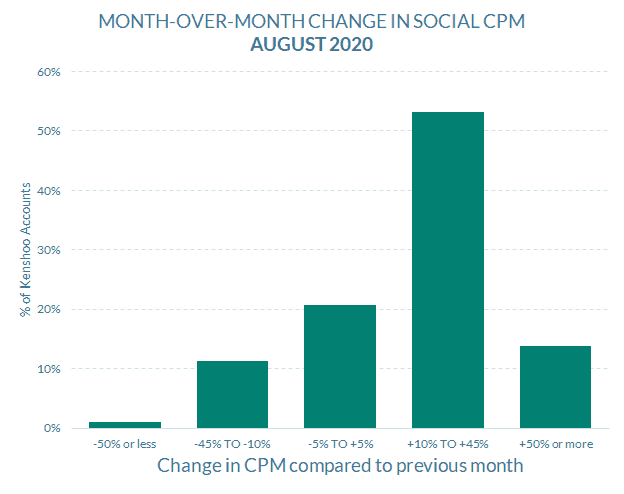
Social advertising CPMs
Ad prices were clearly one factor in the rise of overall budgets, with two-thirds of accounts paying at least 10% more per thousand impressions. Advertisers returning from the July boycott may have increased competition from month to month, driving up prices, while higher-priced political ad spending started to make more of an impact.
- 67% of paid social accounts paid +10% or more per thousand impressions in August compared to July, compared to 12% who spent -10% or less (+55% differential)
- 14% of accounts paid +50% or more per thousand impressions in August compared to July, compared to 1% of accounts paying -50% or less (+13% differential)
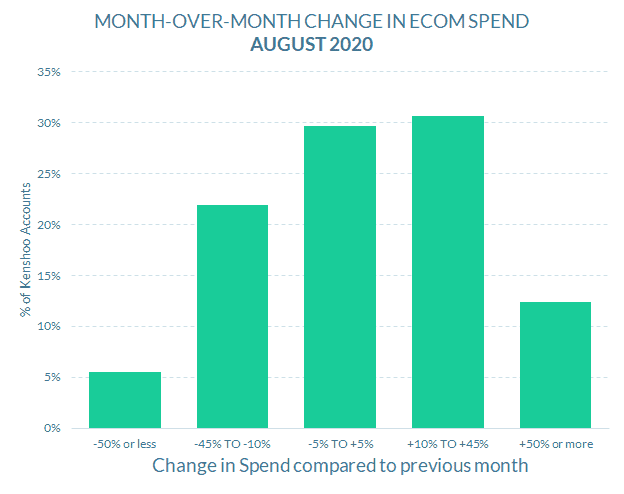
Ecommerce channel advertising spending
Ecommerce budgets were up, on average, compared to July, with increases of 10%-45% slightly more prevalent than staying within 10% of last month.
- 43% of ecommerce advertising accounts spent +10% or more per click in August compared to July, compared to 27% who spent -10% or less (+16% differential)
- 12% of accounts spent +50% or more in August compared to July, compared to 5% of accounts spending -50% or less (+7% differential)
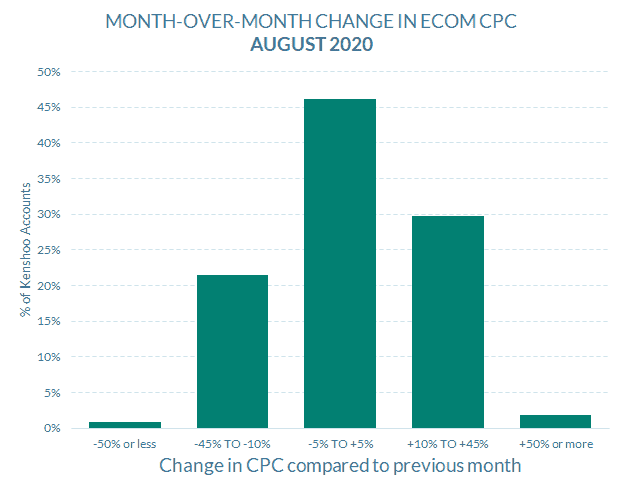
Ecommerce channel advertising CPCs
Ad prices for Ecommerce were up more than they were down on the month but mostly stayed the same, reinforcing the notion that much of the change in campaign budgets comes from volume.
- 32% of ecommerce advertising accounts paid +10% or more per click in August compared to July, compared to 22% who spent -10% or less (+10% differential)
- 2% of accounts paid +50% or more per click in August compared to July, compared to 1% of accounts paying -50% or less (+1% differential)
Check out more resources from Skai
Come back in September for our next monthly trends post. Until then, you can dive into more of our research via our Quarterly Trends Reports hub and our COVID-19 Marketing Resource Center.
And please visit the Skai blog and Research & Reports page for ongoing insights, analysis, and interviews on all things related to digital advertising.