
In the world of digital advertising, there is no shortage of data. Different objectives, varying ad and post types, various platforms and placements and dozens of metrics that measure ad engagement.
In the past, analyzing this data required exporting to a spreadsheet, building pivot tables and manually adjusting the data so you could derive insights and make decisions. To do this successfully, it often feels like you need a Ph.D or at least an advanced degree in Excel.
The Days of Exports and Pivot Tables are Over!
Skai’s Analysis Grid makes decision-making easier than ever before, allowing you to group ads by up to 10 different attributes, filter by the performance that matters most and then analyze the data so you can understand what’s working and what’s not. And, perhaps best of all, you can take immediate action to optimize performance, create video audiences, and refresh your ad copy and creative all in one place.
So, how do you make the most of it? Here are some great ideas for maximizing the benefits of the Analysis Grid. These tips will not only help you save time but they will also provide even richer insights.
Drill down to 10 different attributes, analyze and take action in bulk.
Analyzing Data
1. Post Attributes
Post type ads look like organic posts and are very popular among advertisers. On Facebook, it’s easy to see the performance of each post, but how can you compare which attributes are driving performance? A small adjustment in the body text or a different call-to-action (CTA) could increase user interactions. In the Analysis Grid, you can quickly and easily compare these differences.
We recommend analyzing by the following attributes to see if anything pops: post type, headline, body, image/video name or CTA. This type of analysis will allow you to compare how small differences in creative may influence the performance of your ads, allowing you to focus on making these improvements in future ad creative.
2. Objectives
Facebook offers advertisers a variety of campaign objectives which align with specific formats and buying options. However, at Skai, we have learned that sometimes an advertiser’s goal can be better achieved using a different objective than the obvious one.
For example, advertising your products in a dynamic mobile app install ad might drive more installs than a regular mobile app install ad. We’ve also seen that clicking on the “Visit Website” link in lead ads can sometimes deliver more conversions than regular website conversions ads.
Choose to group by the objective attribute in the Analysis Grid and add the performance metrics that matter to you. You might be surprised at what you find!


Simplifying Analysis
3. Save Your Views
Choosing the right attributes to analyze can sometimes be challenging, but once you find a winning combination, you will want to use it again and again. You can now choose the attributes you need along with their order, and then save these settings under a recognizable name.
For example, I would save the Post type>Headline>Body>Image>Call to action in a view named “Posts Analysis”, and the “Objective” example in a view named “Objectives Comparison” allowing me to perform these two analyses quickly in the future.
4. Share Views
Another cool option is sharing your saved views with others. If you found a view that works for you, your co-workers can easily use it as well instead of figuring it out on their own.
5. Use Long Time Ranges
Usually, when you want to monitor new activity you will look at yesterday or today to get the most updated metrics. However, when the goal is to analyze your data and understand what works and what doesn’t, I recommend using longer time ranges. When you’re analyzing the performance of a week or more, you screen out the noise that can be caused by seasonality (weekends, holidays).
Taking Action
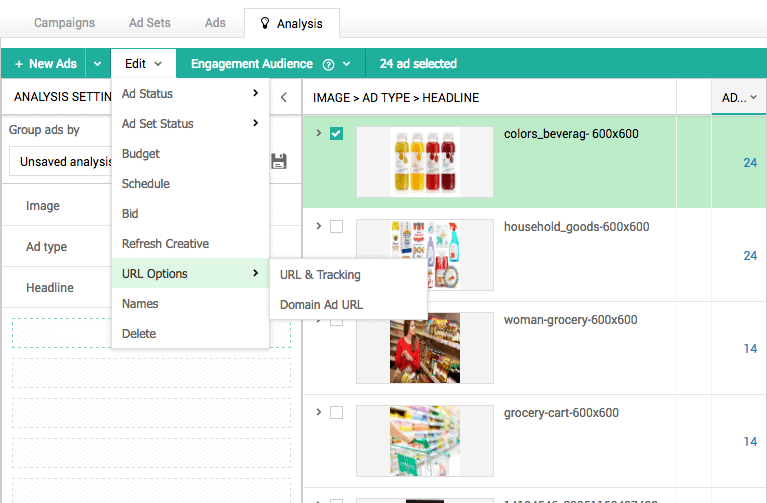
So, you sliced and diced your data, understood what works and what doesn’t, and now it’s time to act. With a clear view of performance pivoted by the relevant attributes in the Analysis Grid – taking the next action is immediate. Just select what you wish to change and click on the edit menu.
From this menu, you can easily alter ad sets, ads and creatives – statuses, budgets and bids, scheduling, images and more.
Ready, Set, Analyze!
We hope we’ve inspired you to take advantage of the Analysis Grid. Incorporate these tips into your daily routine and you’ll get fast insights and be able to act upon them quickly.
What are you waiting for? Go start analyzing your data!