
Another quarter has come to a close and, as captured in our Q3 search and social infographics, digital marketers are continuing to invest in both search and social advertising, generating synergies across channels that have driven increases in total return on investment.
As with the past few quarters, paid search remains fairly stable, as the mature channel continues to drive consistent returns. In the Skai Search and Social Snapshot: Q3 2014, you’ll see that key paid search performance metrics only fluctuated a few percentage points quarter-over-quarter (QoQ) but all in directions that point to improved campaign efficiency.
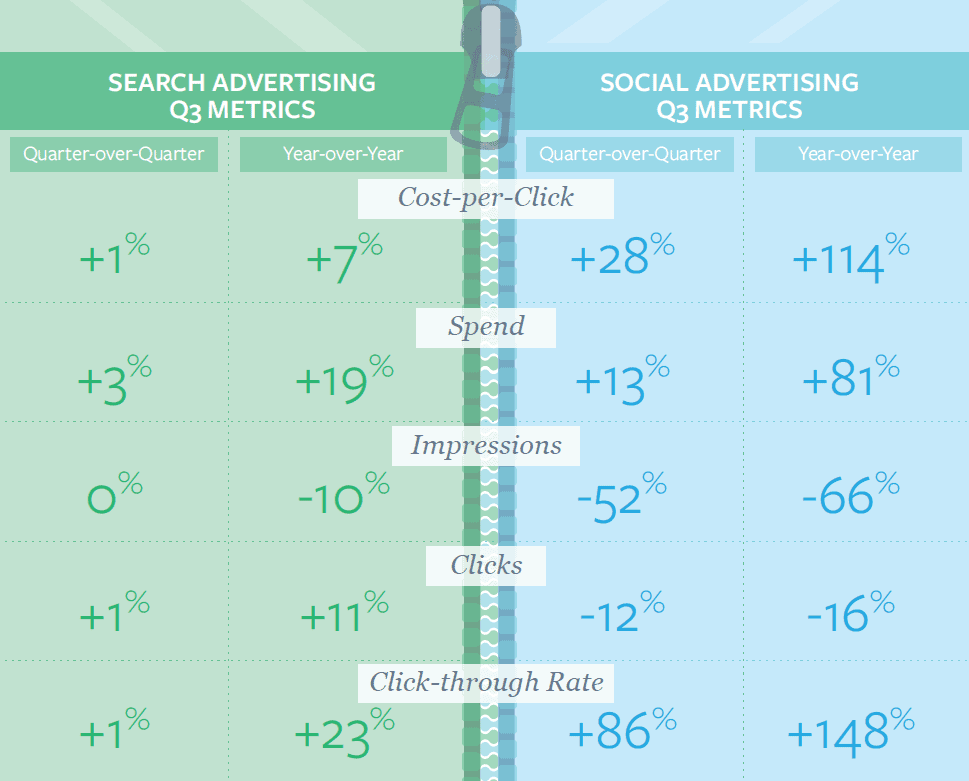
The consistency in search is countered by the spikier performance across social advertising, which saw an 81% lift in spend year-over-year (YoY) and 86% QoQ increase in click-through rate. This is largely attributed to structural changes in Facebook advertising and increased competition. The latter is likely behind the 28% QoQ increase in cost-per-click (CPC) as well. Another reason for the fluctuation in these metrics is Facebook placing more emphasis on News Feed placements vs. Right Hand Side.
Since global paid search is fairly stable, taking a look at regional performance can help to uncover trends specific to certain geographies. In the Skai Search Advertising Trends Infographics, we highlight insights specific to the Americas, Europe, Middle East, and Africa (EMEA), and Asia Pacific Japan (APJ).
Paid search revenue and spend in APJ has grown tremendously year-over-year as marketers continue to see strong returns. In addition, marketers in APJ have achieved greater efficiencies in Q3 than any of the four quarters prior with click volume increasing 26% YoY and impressions decreasing 4% YoY thanks to a 32% increase in CTR.


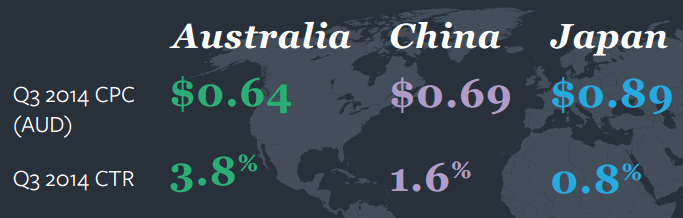
Drilling down even more, we see performance vary from country to country in APJ. As shown in the chart below, Australia continues to show strong click-through rates for the region whereas the low CTR and high CPC in Japan suggest that marketers there are using paid search for branding rather than direct response.
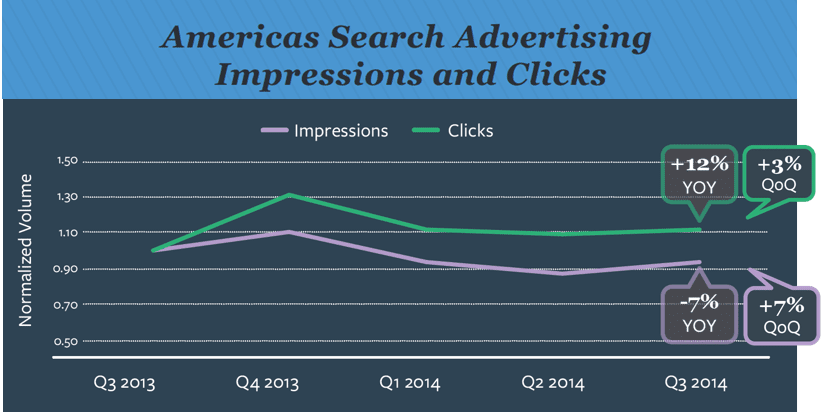
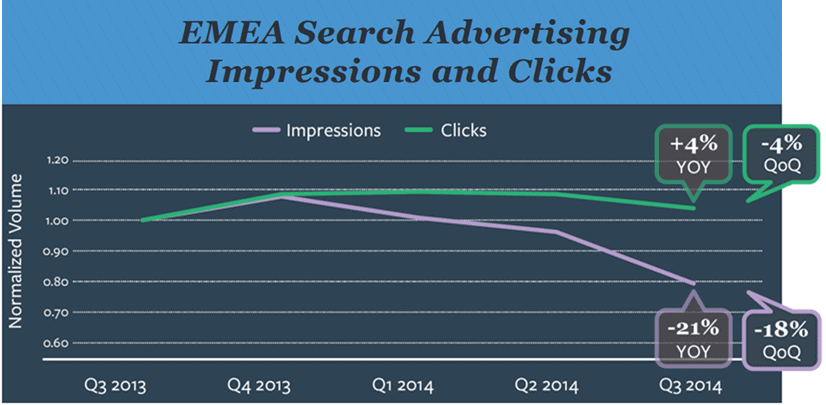
Q3 paid search trends in EMEA and the Americas tell similar stories when looking through a YoY lens. Both regions saw around 20% YoY increases in revenue with slight YoY increases in clicks and decreases in impressions, as shown below.
In addition, from a mobile perspective, share of spend and clicks from mobile devices in both the the U.K. and the U.S. continues to grow QoQ with 32% of spend and 26% of clicks in the U.S. and 38% of spend and 39% of clicks in the U.K. coming from mobile devices. Although mobile share continues to increase QoQ, mobile CPCs (across both tablet and phone) seem to be leveling off in both regions.
Hungry for more data? View the Skai Search and Social Snapshot for all Q3 2014 global search and social advertising insights and the regional Skai Search Advertising Trends Infographics for highlights specific to the Americas, EMEA and APJ.