Prime Big Deal Days 2026 produced 2.8x the normal revenue in two days, and the buildup started in early September. Advertisers spent the month building momentum on cheaper, more engaged clicks than last year, and the two-day peak paid that off with higher conversion and bigger baskets. For advertisers, Q4 began in September.
Analysis Methodology
Our Prime Big Deal Days 2026 analysis uses same-store Amazon Ads data from Skai accounts that advertised during both the 2025 and 2026 events, which keeps year over year comparisons clean. We also benchmark the daily average of the even days (October 6-7) against the ramp-up period, the daily average of the 30 days leading into the event (September 6 to October 5). That baseline shows what a normal day looked like and how large the peak was against a month that was already building.
When Amazon added a second Prime event to its fall calendar in 2022, it looked like a way to find a way to secure a place in the Black Friday and Cyber 5 discussion. Amazon has run one every fall since, and the market keeps growing: U.S. consumers spent $9.86B online across retailers during the two days, up 8.5% YoY, a faster growth rate than last year’s 7.3%.
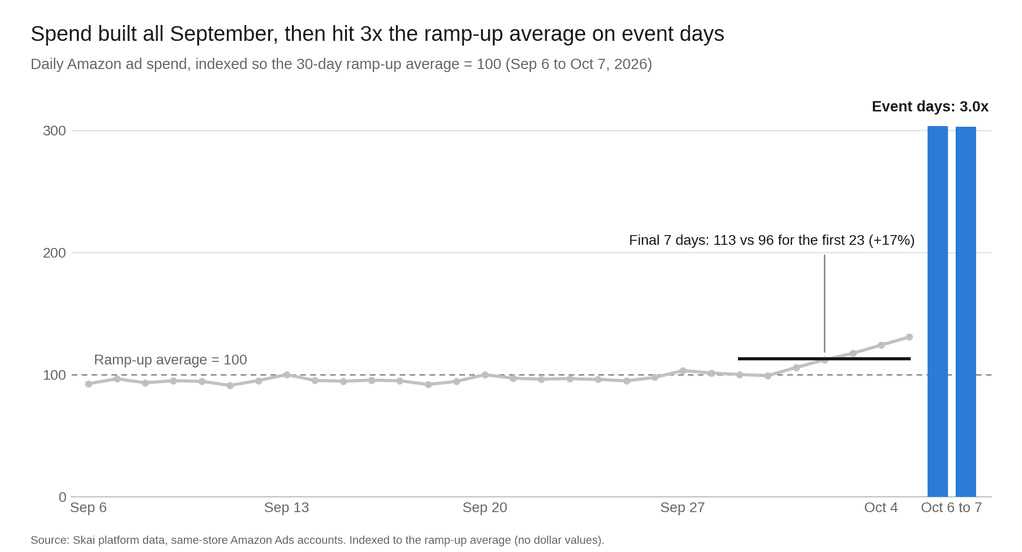
September has long been the quiet stretch for consumers, between back-to-school and the holiday build, and in our data that stretch now belongs to Amazon. That’s simply because 25 of the 30 ramp-up days fall in September. Daily ad spend in the final week ran 17% above the first 23 days, so brands kept building momentum until the deals went live.
The advertising timeline looks different from the sale timeline. In Skai platform data, 83% of Amazon ad spend across the 32-day window landed before the event opened. Brands started building in the first week of September for a sale that lasts two days.
[Chart 1: Spend built all September, then hit 3x the ramp-up average on event days.]
Brands keep showing up because September pays them back. Compared with the same window last year, ramp-up clicks grew 9%, CPC fell 9%, and CTR rose 13%. September has become a magnet for ad budgets.
Amazon DSP led the way. Ramp-up DSP clicks were up 76% YoY with CPC down 25% and CTR up 38%, pointing to increased audience-building activity ahead of the event.
Industry data points the same direction. Analysts now measure the event against an average September day, and the lifts are large: toys rose 158% and electronics 85%. October alone is forecast at $95.8B in online sales, up 8%, which is roughly a third of the total of the entire November and December window. Industry analysis says the event created an additional pre-season spike in shopping interest. Ad budgets moved with it.
The peak delivered: 2.8x revenue and better clicks than last year
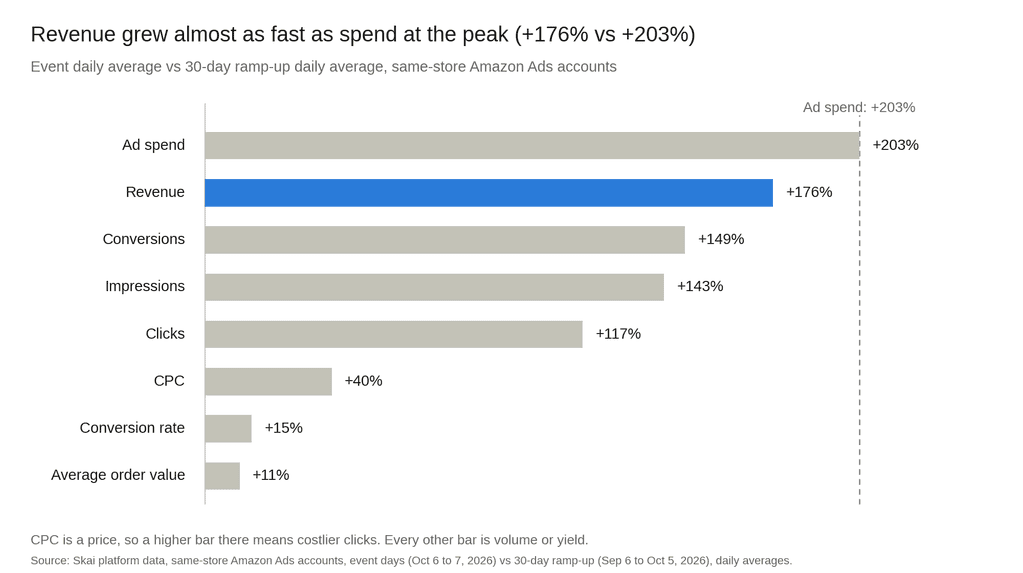
The two-day peak turned a month of momentum into 2.8x normal revenue. Measured against the ramp-up daily average, the event daily average looked like this:
[Chart 2: Revenue grew almost as fast as spend at the peak (+176% vs +203%)]
Conversion rate ran 15% above the ramp-up average, and average order value rose 11%, from $31.92 to $35.42. Independent data supports the same trend: average order size rose 7% YoY, and the share of the most expensive goods rose 21% over the year-to-date average, with electronics up 45% and personal care up 34% as markdowns of up to 20% led consumers to trade up.
That combination protected returns. CPC rose 40% over baseline, and Day 1 ROAS still landed within 2% of its 30-day baseline. Day 1 revenue ran 199% above baselene and Day 2 held strong at 154% above baseline, with spend level across both days.

Against last year’s event, clicks were cheaper and more engaging. CPC was 9% lower ($1.46 vs $1.61), CTR was 9% higher (0.41% vs 0.37%), and Day 2 clicks beat last year’s Day 2 by 2%. Consumers also picked Amazon for the occasion: household spending there nearly doubled vs an average Tuesday and Wednesday, four times the lift Walmart recorded in the first two days of its own sale.
Conversion rate sagged about 13% below the month’s average in the four days before the event, then ran 29% above that low once the deals went live. That pattern is consistent with consumers holding their carts for the event, and it will likely repeat before Black Friday.
Where the formats landed
Each Amazon Ads format earned its spot for a different reason.
- Amazon DSP built the base and closed strong. Event clicks were up 17% YoY, with CTR up 9% and CPC down 8%. DSP was the only major format to beat its own baseline on ROAS (+26%), with conversion rate up 68%.
- Sponsored Brands produced the most valuable orders. AOV was $44 vs $36 for Sponsored Products and ROAS ran 28% higher. CTR rose 35% YoY and 23% over the ramp-up, making it the only major format where CTR climbed during the event.
- Sponsored Products carried the volume. Its revenue was up 167% over the ramp-up, with CPC 12% below last year and CTR 9% above it.
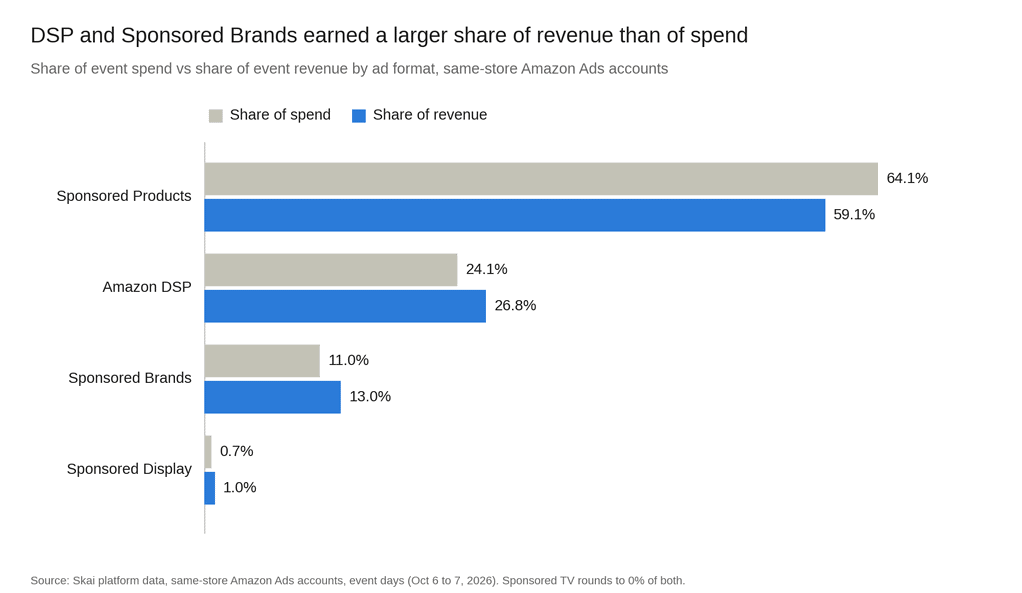
[Chart 3: DSP and Sponsored Brands earned a larger share of revenue than of spend.]
Sponsored Products captured demand, Sponsored Brands raised basket size, and DSP built and retargeted audiences across the full window. Brands that ran all three covered the path from September browsing to October checkout.
A first look at what consumers want this holiday
October gives marketers their earliest read on what consumers want this season. The event works as a litmus test, with shoppers spending real budgets against real deals five weeks before Black Friday.
Industry data showed the biggest category jumps over an average September day in toys (+158%), video games (+90%), electronics (+85%), and personal care (+73%). Within electronics, headphones and speakers rose 300% and smartwatches 255%. Consumerss also stocked up on household basics, with cleaning and paper sales up 55% and personal hygiene up 45% YoY. Stocking up and trading up happened side by side.
Skai’s ad data follows the same pattern.
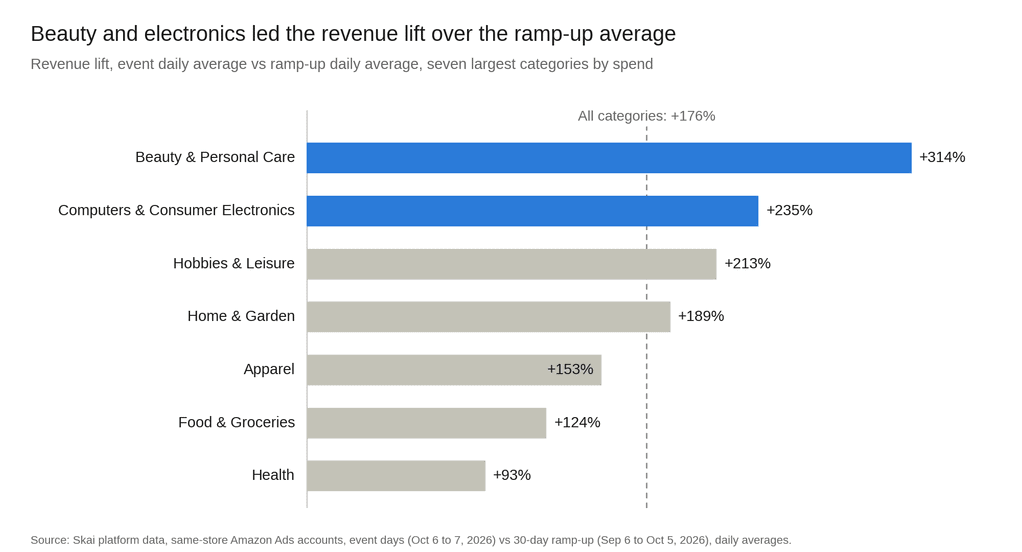
[Chart 4: Beauty and electronics led the revenue lift over the ramp-up average]
- Computers & Consumer Electronics: spend +353% during the event over the ramp-up, with the highest AOV of any major category ($142, up 13%).
- Beauty & Personal Care: conversion rate +29% and AOV +16%, with ROAS holding at baseline.
- Hobbies & Leisure: conversion rate up 69% over the ramp-up.
- Gifting: Occasions & Gifts spend rose 164%, and more than a third of consumers finished at least half their holiday shopping during the event.
EMEA moved fastest. With the event running in 22 countries, EMEA revenue rose 242% over the ramp-up vs 161% in AMER, and AOV rose 35%. Its ramp-up clicks were already up 33% YoY with CPC down 10%, so the build started early there too.
How to turn October’s signals into Black Friday and Cyber Monday wins
The ramp-up pattern makes a workable Q4 template, and these six moves apply it before November.
- Bank the cheaper clicks, then plan for the peak. Ramp-up clicks cost 28% less than peak clicks ($1.05 vs $1.46), and peak clicks converted 15% better. Budget for the whole window so you capture both.
- Build DSP before the peak. Ramp-up DSP clicks were up 76% YoY at a CPC 25% lower, and DSP posted the best ROAS gain at the peak (+26% over its own baseline). Use September and October to build the audiences you retarget in November.
- Start your Black Friday ramp on October 28. Black Friday falls on November 27, and 30 days back lands on October 28. Consumers are checking items off earlier: more than a third finished at least half their holiday shopping during the event, and intent to shop Black Friday and Cyber Monday slipped 4 and 5 points vs last year. Meet them while the list is still open.
- Use Sponsored Brands to lift basket size. With an AOV of $44 vs $36 for Sponsored Products, it is the natural home for bundles and cart-threshold offers, especially as consumers trade up to higher-ticket items.
- Run October as your litmus test. Compare your own category lifts with the benchmarks above, then put November creative and budget behind the products that surged.
- Design for mobile first. Mobile accounted for 52% of event sales, up 12.8% YoY, and pay-over-time options covered 6% of orders. Lead with price and deal clarity on small screens.
Make your September count in Q4
Brands that treated Prime Big Deal Days as a 32-day event gained reach at a lower cost per click and saw bigger baskets at the peak. The same approach applies to Black Friday and Cyber Monday, and its clock starts on October 28.
Skai’s retail media solutions help teams plan and measure campaigns across Amazon, Walmart, Target, Instacart, and 300+ retail media networks, with paid search and social in the same view and every dollar of spend tied back to sales. Schedule a quick demo to see how it works.
Frequently Asked Questions
About 30 days before each peak, which puts the Black Friday start at October 28. Prime Big Deal Days 2026 showed how much activity the buildup carries: 83% of ad spend in the 32-day window landed before the event opened.
Over the two days, ad spend ran 3x the ramp-up daily average and revenue ran 2.8x. Conversion rate rose 15% and AOV rose 11%. CPC came in 9% below last year’s event.
It is a month of cheaper clicks (28% lower CPC than the peak) and the window where brands build audiences and reach before consumers are ready to buy. Skai benchmarks the event against the daily average of the 30 days beforehand, which shows how large the peak was against a baseline that was already building.
More like this
-

Who Owns AI Agent Strategy Now? Meet the New Buying Committee
-

From AI Assistance to Agentic Execution: Skai’s Take on Amazon Ads unBoxed 2026
-
Ready for AI Agents to Do More? Inside Skai’s 34-Tool Agent Connect Launch
-
The Road to Agentic Marketing: Skai at Amazon Ads unBoxed 2021-2025
-
Who’s Accountable When AI Agents Buy Media?
-
From Insights to Action: A Practical Framework for Governed AI Agent Execution