Breaking down monthly trends across digital channels by industry category
This analysis builds on the Monthly Paid Media Snapshot to look at changes in spending and ad prices by industry category. As with any benchmark, your results may vary, but we hope this provides more context for you as a marketer as you navigate the ups and downs of your program’s performance.
How to read these charts
There are two charts for each channel. The first bubble chart shows month-over-month (MoM) changes in ad pricing–average cost per click (CPC) for paid search and retail media and average cost per thousand impressions (CPM) for paid social on the x-axis and MoM changes in ad spending on the y-axis. For example, a bubble in the upper right quadrant of the chart means both price and spending increased. The size of the bubble does not reflect anything except the overall channel having the larger bubble in each instance.
The diagonal line indicates spending changes that are completely described by the change in pricing. Bubbles above the diagonal mean that ad volume—clicks for retail media and paid search, impressions for paid social—grew faster than pricing, while bubbles below the diagonal mean that volume grew slower.
The second chart in each series shows actual CPC/CPM by category for the current month and the previous month. Bubble size, again, simply differentiates the overall channel value from the individual categories.
Retail Media
Overall, retail media spending decreased 26% in August, while average CPC dropped 13%.
Retail media was largely a mirror image of last month, with the categories that increased the most for Prime Day giving back those higher spending levels. Home & Garden, Computers & Electronics, Hobbies & Leisure and Beauty & Personal Care all dropped more than average in terms of both spending and CPC, while no category saw either spending or prices increase.

Family & Community was the highest-priced category in August, and was one of two verticals that did not see much change in CPC from last month. Apparel was the lowest-priced category, and the biggest CPC drops came from categories that were just below the overall average for the channel.

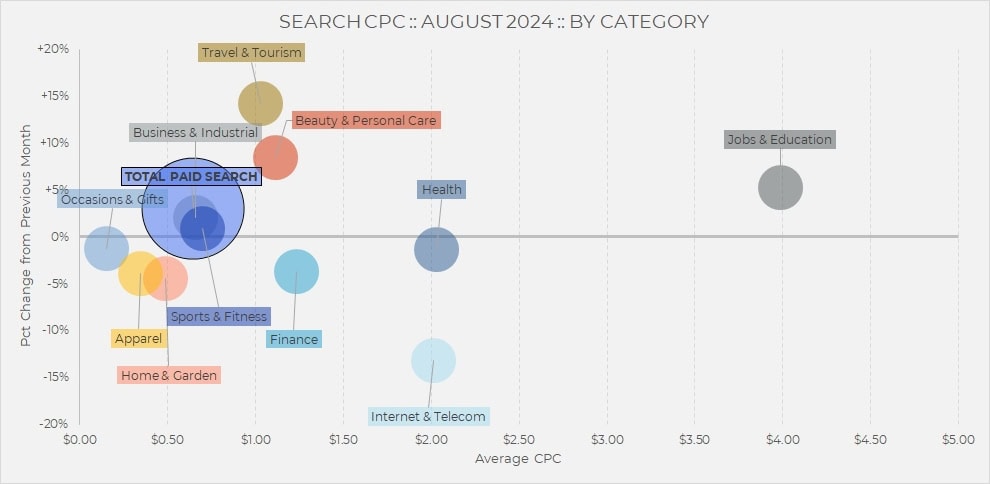
Paid Search
Overall paid search spending decreased 2% in August, while average CPC increased 3%


Travel & Tourism was up again after being down last month, but it was Sports & Fitness that saw a 20% increase in spending despite no change in CPC. At the other end of the spectrum, Occasions & Gifts was down the most, but also with very little change in pricing, which means click volume was the decisive factor there. Internet & Telecom was down again, mostly due to lower CPCs compared to last month, while Home & Garden spending also decreased.

The biggest month-over-month moves in CPC came from Travel & Tourism with a 14% increase to $1.03 and Internet & Telecom, dropping 13% to $2.01. Jobs & Education maintained its place as the highest-priced category across paid search.
Social Advertising
Overall, paid social spending increased 8% in August, while average CPM grew 3%.
Most notably, both Health andFinance saw big increases in social spending while CPM changed by less than 5%, meaning that impression volume grew sharply for both categories. This could reflect changes in strategy such as a shift towards upper funnel tactics and awareness.

As with paid search, Jobs & Education has the highest CPM across social categories, with Health and Apparel at the lower end of that scale. Food & Groceries CPM grew 9% to reach $4.45, while Apparel dropped 8% from last month, ending up at $2.80.

Check out more resources from Skai
Come back next month for the most up-to-date data. Until then, you can dive into more of our research via our Skai Research Center or Quarterly Trends Reports hub.
And please visit the Skai blog and Whitepaper Library for ongoing insights, analysis, and interviews on all things related to digital advertising.