Next week, Skai will publish the final edition of our annual Global Online Retail Seasonal Shopping Report with key insights and recommendations following the 2013 holidays. (Note: you can download the Early Edition that was published just after Cyber Monday here.)
This robust report will provide an in-depth analysis with charts and graphs on the entire season as well as a spotlight on key dates such as Thanksgiving, Black Friday, and Cyber Monday. Retailers should find some interesting nuggets that will help add context to the performance of paid search campaigns during this time as well as some good things to think about as 2014 programs get underway. With nearly 40% of the Top 50 Internet Retailers powered by Skai, we have a pretty unique vantage point on the industry and I’m always excited to dig into the data and see the latest trends.
Even though it’s no surprise that 2013 was the biggest online shopping season on record, as I step back and assess the bigger picture, I’m still blown away at just how fast digital marketing (and paid search in particular) is contributing to the overall success of the U.S. shopping season. The findings were especially compelling as there were lower expectations since 2013 had the shortest shopping season in 11 years!
Every year, the numbers keep going up but there were a few key trends that best demonstrate just how big this channel is growing and it certainly doesn’t look like it’s going to slow down anytime soon. You will be able to get the full edition in your hands next week, but for now, here are the three key trends from the U.S. paid search market that are undeniably big news for the digital marketing industry:
U.S paid search spend up double digits YoY during 2013 U.S. shopping season
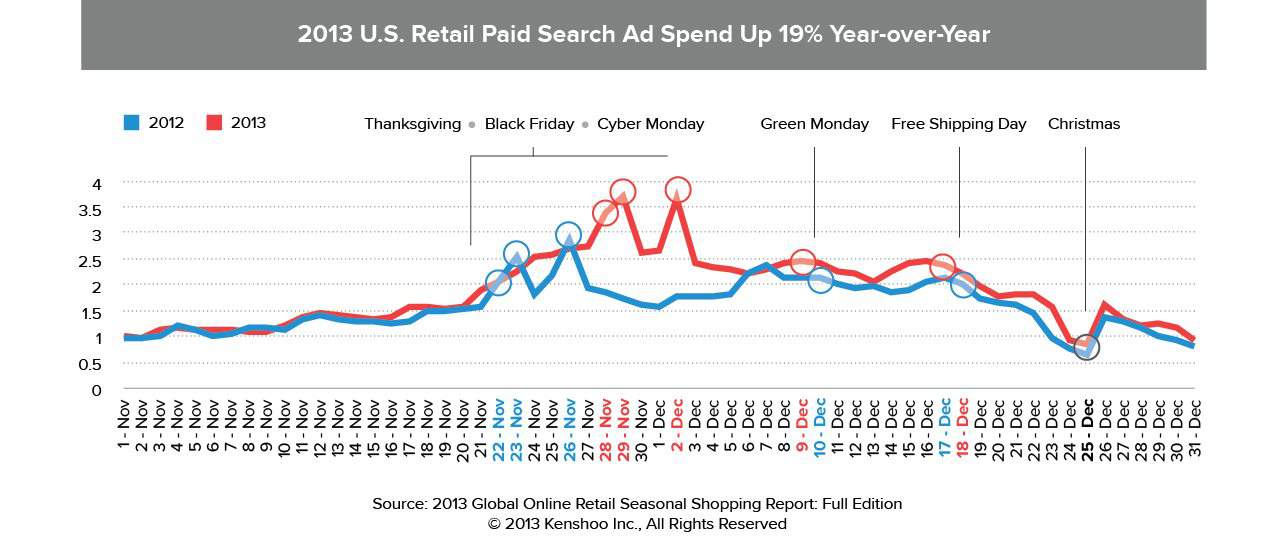
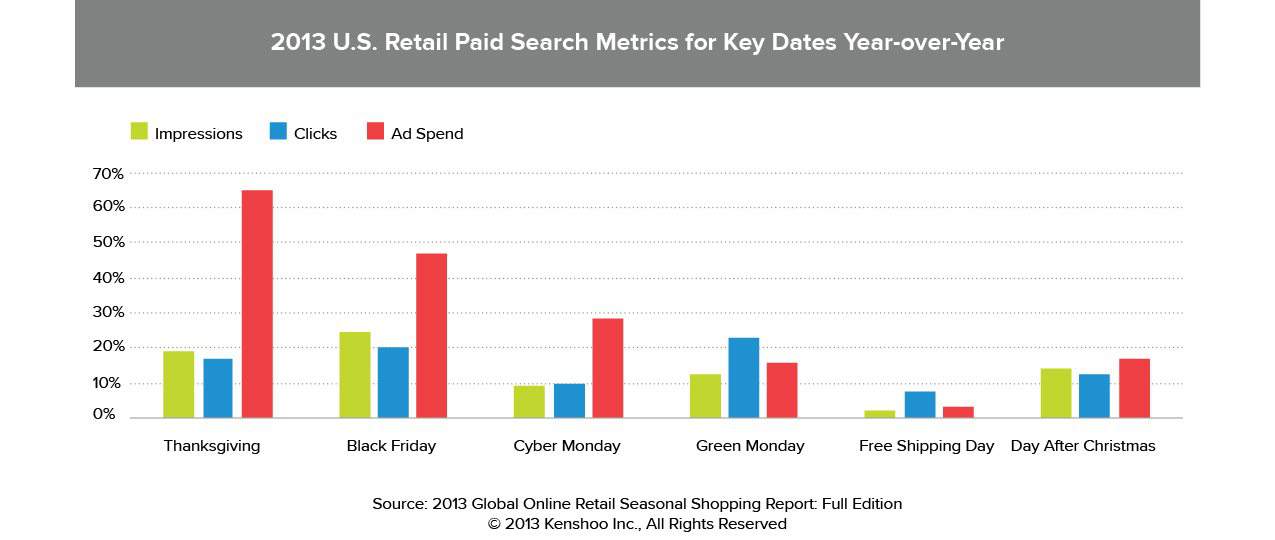
Thanksgiving has traditionally kicked off the major lift in advertising spend, but retailers ramped up spending earlier in anticipation that consumers would begin shopping earlier this year. As you can see in the day-over-day (DoD) chart, spending on the days leading to Thanksgiving 2012 rose steadily, but in 2013, there was a dramatic uptick in spending after the first few weeks. Tremendous increases in spend were observed during the 2013 U.S. shopping season on Thanksgiving Day and Black Friday with 65% and 47% YoY increases respectively.
While retailers generated a YoY increase in clicks and impressions on all key dates in 2013 (such as Green Monday and Free Shipping Day) delivered the most return on investment. On Green Monday, U.S. retailers saw a 23% YoY increase in clicks while only increasing spend by 16% YoY. Similarly, retailers upped their ad spend on Free Shipping Day by 3%, yet observed an 8% YoY increase in clicks. Online retailers should keep this in mind for next year and invest on these key dates to see the best return.
More than 1 out of every 3 U.S. paid search clicks originated from mobile devices during the 2013 shopping season
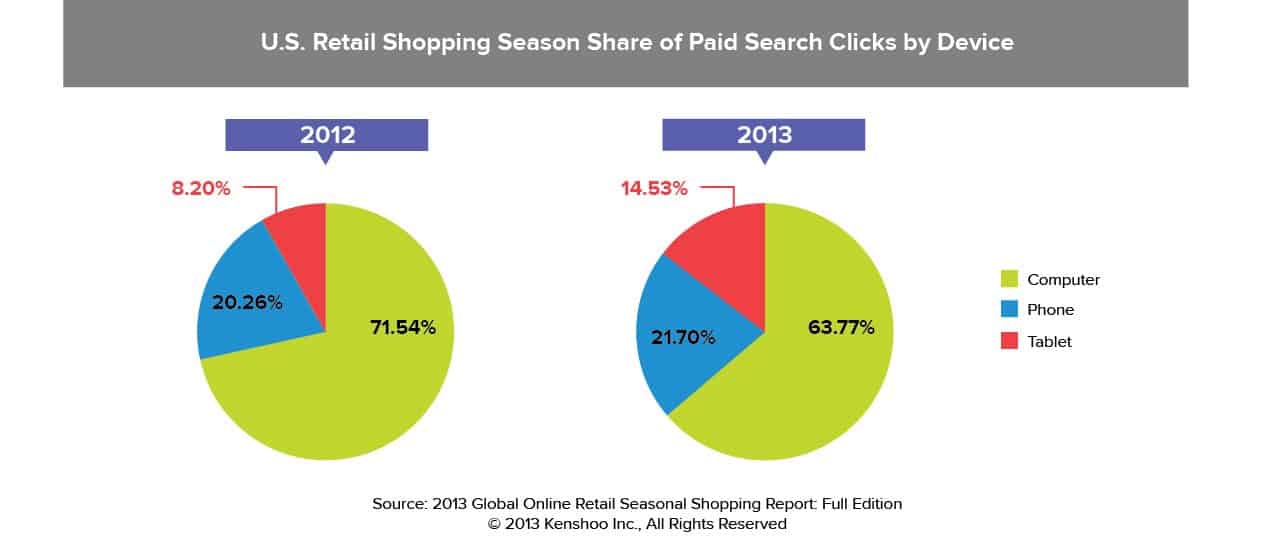
36% of all U.S. paid search clicks came from mobile devices in the 2013 shopping season, a 27% YoY increase from 2012. The biggest driver came from tablets, where clicks jumped from 8% of total clicks in 2012 to 14.5% of total clicks in 2013 (a lift of 77% YoY). Phone clicks increased just 7% YoY to 22% of total clicks.
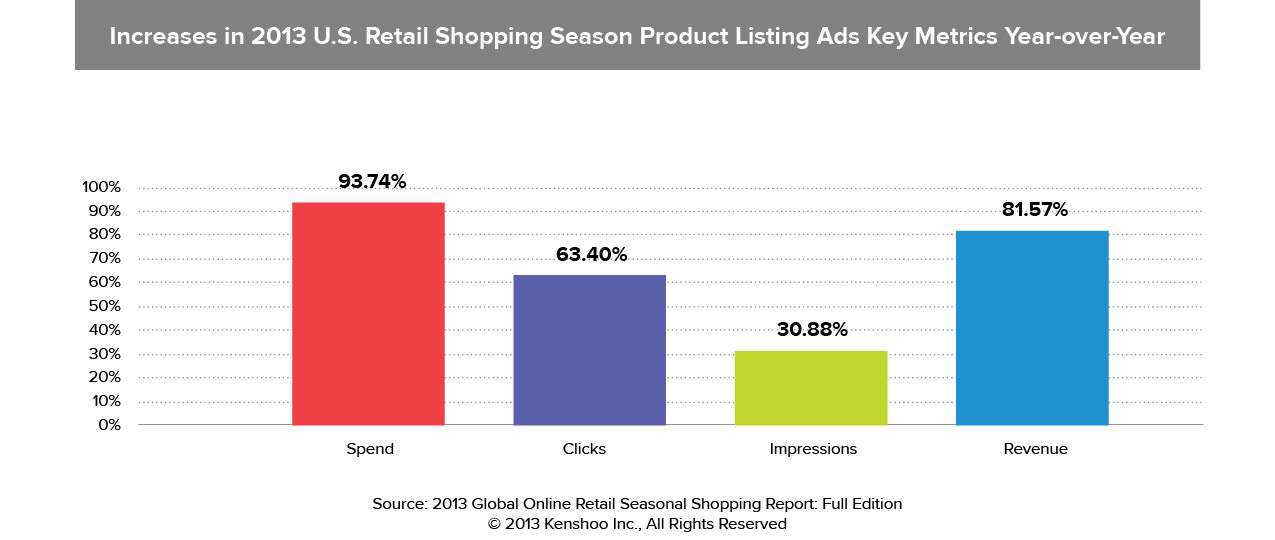
U.S. online retailers embrace PLAs during the 2013 shopping season with nearly 100% YoY increase in ad spend
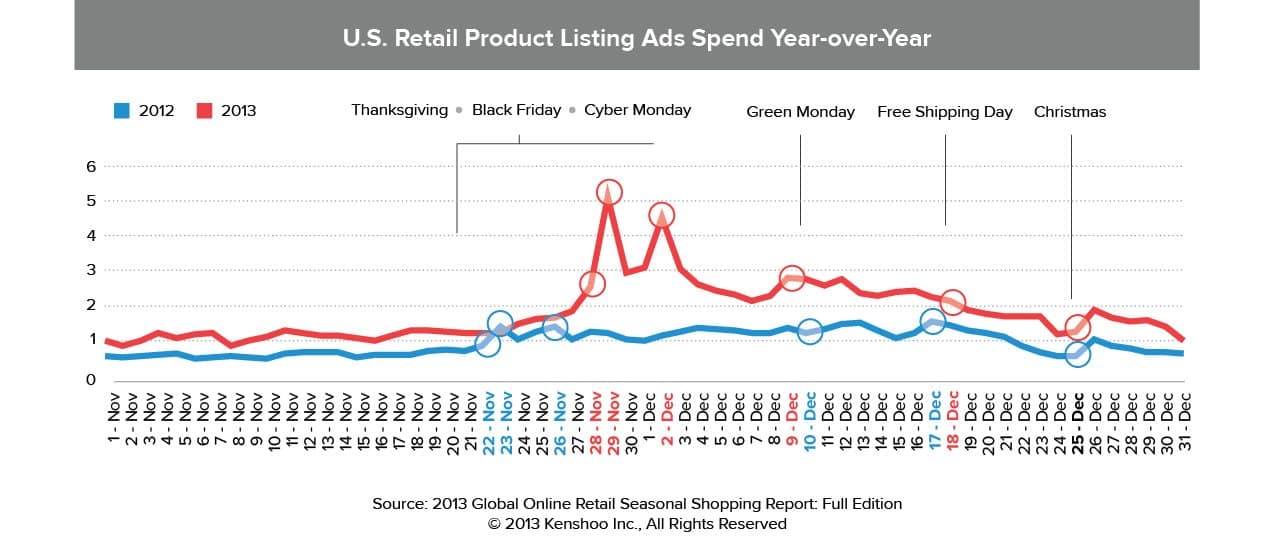
Product Listing Ads (PLAs) provide prime location on the search results page for retailers to capture online traffic. U.S. retailers spent nearly 100% more YoY on product listing ads during the 2013 peak shopping season. With a 63% YoY increase in clicks and 82% YoY increase in revenue, this ad type proved to be very effective.
As seen in the day-over day chart, ad spend for PLAs stayed relatively consistent throughout the 2013 U.S. shopping season except for key dates. On Black Friday and Cyber Monday, ad spend spiked 268% and 220% respectively YoY. FYI, the growth in PLAs was even more pronounced in the U.K.
This is just a taste of what we will be sharing next week in the Global Online Retail Seasonal Shopping Report: Final Edition. Be sure to come back to Skai.com and download the full report and see key findings for retailers the U.S. and U.K. as well as a global roll-up. We’ll also be publishing our quarterly global search trends report in the coming weeks which is inclusive of all verticals so stay tuned for more insights.
